I'm always tinkering with new trading ideas and running backtests. It's one of my favorite parts of being a trader—exploring what works, what doesn't, and why. Recently, I came across a Reddit post in r/algotrading that caught my attention. The poster claimed an 81.6% win rate with impressive gains using a momentum-based approach. Naturally, I had to test something similar myself.
This is a stock-only strategy—no options involved yet. I often start with stock strategies because they're simpler to backtest and validate before considering how to adapt them to options. Could this become a put selling strategy or something more sophisticated? Maybe. But first, I wanted to see if the core concept held water.
The Strategy: Momentum Meets Mean Reversion
The Momentum RSI strategy combines two well-documented market effects:
- Momentum Effect: Stocks that have outperformed recently tend to continue outperforming
- Mean Reversion: Even strong stocks experience temporary pullbacks that tend to revert
The core idea is simple: trade only high-performing stocks, but enter when they're temporarily oversold. You're essentially buying the dip on winners—stocks that have already proven themselves but are experiencing short-term weakness.
Strategy Parameters
Here's exactly what I tested. Every parameter is documented so you could replicate this yourself:
| Parameter | Value | Description |
|---|---|---|
| Universe Selection | ||
| Min Market Cap | $2B | Filter out smaller, more volatile stocks |
| Universe Size | 150 | Maximum stocks in trading universe |
| Min 3-Month Return | 45% | Minimum performance threshold |
| Min 6-Month Return | 55% | Minimum performance threshold |
| Min 12-Month Return | 75% | Minimum performance threshold |
| Universe Refresh | 2 weeks | How often to rebuild the universe |
| Entry Signal | ||
| RSI Period | 14 | Standard RSI calculation period |
| RSI Threshold | 30 | Enter when RSI drops below this level |
| Max VIX Rank | 70% | Only enter when VIX is in lower 70th percentile of past year |
| Exit Rules | ||
| Profit Target | 3% | Take profit at 3% gain |
| Max Hold | 10 days | Exit if profit target not hit |
| Stop Loss | None | No stop loss (exits at max hold) |
| Position Sizing | ||
| Position Size | 25% | Each position is 25% of capital |
| Max Concurrent | 4 | Maximum 4 positions open at once |
| Starting Capital | $10,000 | Initial account size |
Backtest Period
I ran this backtest over approximately two years:
- Start Date: January 1, 2024
- End Date: January 17, 2026
- Duration: ~2 years
Results Summary
Here's the high-level performance with the VIX Rank 70 filter applied:
| Metric | Value |
|---|---|
| Total Trades | 91 |
| Winning Trades | 74 (81.3%) |
| Losing Trades | 17 (18.7%) |
| Total P&L | +$3,157.26 |
| Total Return | 31.57% |
| CAGR | 14.36% |
| Final Capital | $13,157.26 |
| Max Drawdown | $1,119.69 (8.7%) |
| Profit Factor | 2.52 |
| Average Hold | 3.9 days |
| Avg Win | +$70.68 |
| Avg Loss | -$121.95 |
| Largest Win | +$95.99 |
| Largest Loss | -$588.42 |
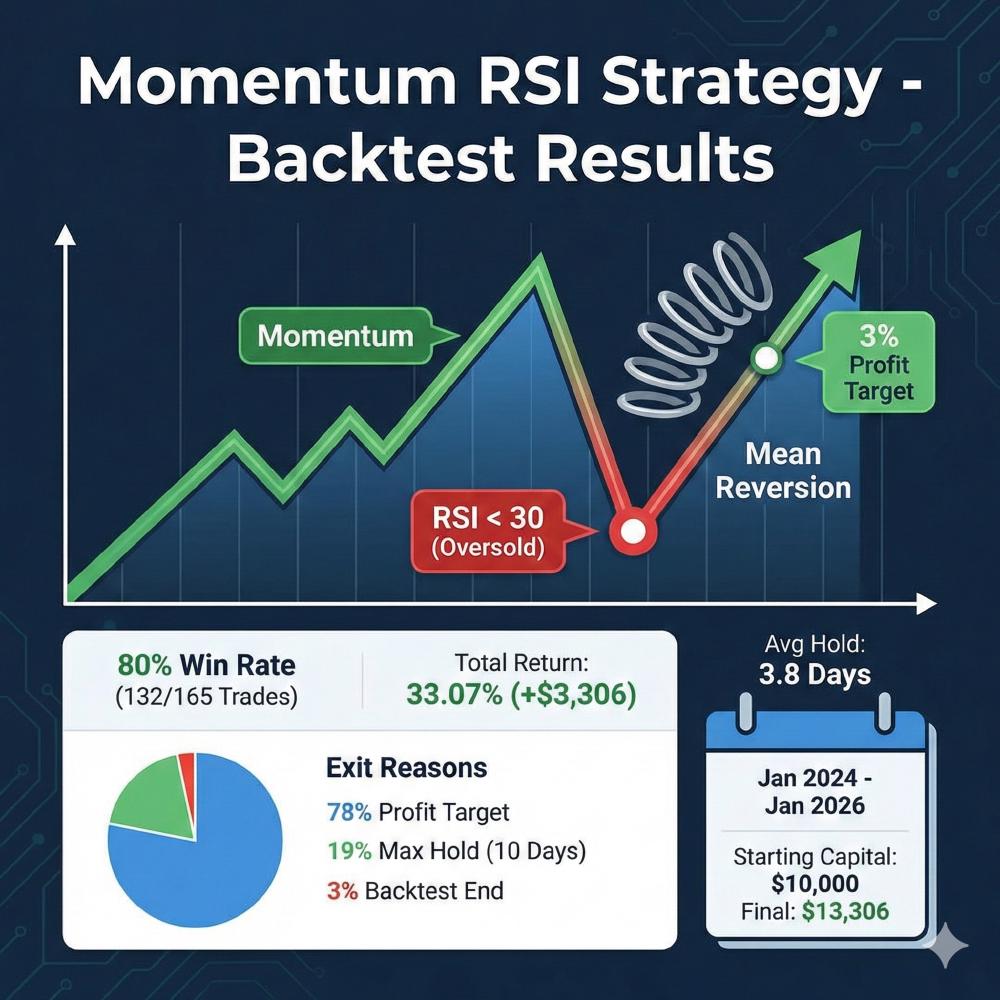
The 81.3% win rate and 2.52 profit factor are the standout numbers. The VIX Rank filter reduced trades from 165 to 91 but dramatically improved risk-adjusted returns. The average hold time of 3.9 days means capital isn't tied up for long.
The VIX Rank Filter: Key Innovation
The most significant improvement to this strategy came from adding a VIX Rank filter. VIX Rank measures where the current VIX sits relative to the past 365 days as a percentile (0-100). A rank of 50 means VIX is at its median level; a rank of 70 means it's higher than 70% of the past year.
Why it works: During elevated volatility periods, even "oversold" momentum stocks are more likely to continue falling. By filtering out high VIX environments, we avoid many losing trades.
VIX Rank Optimization Results
| VIX Rank | Trades | Win Rate | Total P&L | Max DD | Profit Factor |
|---|---|---|---|---|---|
| 0 (off) | 165 | 80.0% | $3,307 | 12.9% | 1.64 |
| 30 | 37 | 81.1% | $1,564 | 2.4% | 4.11 |
| 40 | 49 | 77.6% | $1,768 | 2.2% | 3.16 |
| 50 | 60 | 76.7% | $1,064 | 11.3% | 1.54 |
| 60 | 79 | 79.7% | $2,108 | 11.8% | 1.95 |
| 70 | 91 | 81.3% | $3,157 | 8.7% | 2.52 |
| 80 | 110 | 80.0% | $2,147 | 11.9% | 1.61 |
| 90 | 138 | 79.7% | $2,516 | 12.0% | 1.57 |
Key Findings
- VIX Rank 70 is optimal for balanced risk/reward: near-maximum returns with significantly better profit factor (2.52 vs 1.64) and lower drawdown (8.7% vs 12.9%)
- VIX Rank 30-40 is most conservative: exceptional profit factors (3.16-4.11) and minimal drawdown (2.2-2.4%), but fewer trades and lower total returns
- VIX Rank 50 underperformed—cutting off moderate volatility removed good opportunities
- No filter has highest raw returns but worst risk-adjusted metrics
With vs Without VIX Filter
| Metric | No Filter | VIX Rank 70 | Improvement |
|---|---|---|---|
| Trades | 165 | 91 | -45% fewer trades |
| Win Rate | 80.0% | 81.3% | +1.3% |
| Total P&L | $3,307 | $3,157 | -4.5% |
| Max Drawdown | 12.9% | 8.7% | -32% lower risk |
| Profit Factor | 1.64 | 2.52 | +54% better |
The VIX Rank 70 filter sacrifices minimal returns (4.5%) for substantially better risk metrics. This is the trade-off I'm willing to make—I'd rather have a more robust strategy that doesn't blow up during market stress.
Exit Reason Breakdown
Understanding how trades exit is crucial for evaluating any strategy:
| Exit Reason | Count | Percentage | Avg P&L |
|---|---|---|---|
| Profit Target (3%) | 71 | 78.0% | +$65.54 |
| Max Hold (10 days) | 16 | 17.6% | -$143.21 |
| Backtest End | 4 | 4.4% | -$28.15 |
78% of trades hit the 3% profit target. The max hold exits are where the losses come from—when a stock doesn't bounce within 10 days, you're often sitting on a loss. The VIX filter helps reduce these losing max-hold exits.
Yearly Performance (All Signals)
The tables below show performance across all 165 RSI signals for reference. With the VIX Rank 70 filter applied, 91 of these signals would have been traded—the rest occurred during elevated volatility periods.
| Year | Trades | Wins | Losses | Win % | P&L | Profit Factor |
|---|---|---|---|---|---|---|
| 2024 | 85 | 73 | 12 | 85.9% | +$2,356.76 | 2.13 |
| 2025 | 74 | 57 | 17 | 77.0% | +$961.40 | 1.32 |
| 2026 | 6 | 2 | 4 | 33.3% | -$11.53 | 0.91 |
2024 was clearly the better year with an 85.9% win rate and profit factor over 2. The strategy struggled more in 2025, though it still remained profitable. The 2026 data is too limited to draw conclusions (only 6 trades, some still open at backtest end).
Monthly Performance (All Signals)
| Month | Trades | Wins | Losses | Win % | P&L |
|---|---|---|---|---|---|
| 2024-01 | 2 | 1 | 1 | 50.0% | -$162.44 |
| 2024-02 | 4 | 3 | 1 | 75.0% | +$166.89 |
| 2024-03 | 5 | 5 | 0 | 100.0% | +$338.22 |
| 2024-04 | 10 | 7 | 3 | 70.0% | -$555.30 |
| 2024-05 | 10 | 10 | 0 | 100.0% | +$628.04 |
| 2024-06 | 12 | 11 | 1 | 91.7% | +$636.42 |
| 2024-07 | 10 | 9 | 1 | 90.0% | +$92.91 |
| 2024-08 | 8 | 6 | 2 | 75.0% | -$14.73 |
| 2024-09 | 6 | 6 | 0 | 100.0% | +$447.82 |
| 2024-10 | 4 | 4 | 0 | 100.0% | +$283.21 |
| 2024-11 | 8 | 7 | 1 | 87.5% | +$366.97 |
| 2024-12 | 6 | 4 | 2 | 66.7% | +$128.72 |
| 2025-01 | 11 | 8 | 3 | 72.7% | +$246.16 |
| 2025-02 | 12 | 11 | 1 | 91.7% | +$563.37 |
| 2025-03 | 14 | 6 | 8 | 42.9% | -$1,384.08 |
| 2025-04 | 7 | 5 | 2 | 71.4% | -$91.29 |
| 2025-05 | 3 | 3 | 0 | 100.0% | +$264.55 |
| 2025-06 | 2 | 1 | 1 | 50.0% | -$17.45 |
| 2025-07 | 3 | 2 | 1 | 66.7% | -$72.19 |
| 2025-08 | 10 | 9 | 1 | 90.0% | +$576.34 |
| 2025-10 | 1 | 1 | 0 | 100.0% | +$93.27 |
| 2025-11 | 10 | 10 | 0 | 100.0% | +$687.79 |
| 2025-12 | 1 | 1 | 0 | 100.0% | +$94.93 |
| 2026-01 | 6 | 2 | 4 | 33.3% | -$11.53 |
March 2025 stands out as the worst month—a -$1,384 loss with only a 42.9% win rate. This is where having multiple strategies in your arsenal matters. No single approach works all the time, which is why I trade SPY Put Credit Spreads and the Wheel Strategy alongside my experimental backtests.
Key Observations
- High Win Rate: 81.3% of trades hit the 3% profit target
- Quick Exits: Average hold time is only 3.9 days
- VIX Filter Works: Reduces drawdown by 32% with minimal return sacrifice
- Asymmetric Risk: Winners average +$71, losers average -$122 (but losers are rare)
- Profit Factor: 2.52 means gross wins are 2.5x gross losses—a healthy ratio
Risk Considerations
No backtest is complete without discussing what can go wrong:
- No Stop Loss: Losses are only capped by the 10-day max hold rule. This means a stock could drop significantly before you exit.
- VIX Filter Helps: The filter reduces exposure during market stress, but doesn't eliminate risk entirely.
- 100% Exposure: With 4 positions at 25% each, you can have 100% of capital at risk simultaneously.
- Max Drawdown: 8.7% drawdown with the VIX filter (down from 12.9% without)—more manageable but still significant.
As I discuss in my article on backtesting and data analysis, past performance doesn't guarantee future results. This strategy worked over the test period, but market conditions change. The VIX filter should help during future volatility spikes, but it's no guarantee.
Complete Trade Log (91 Filtered Trades)
Full transparency—here is every trade taken with the VIX Rank 70 filter applied. The table now includes VIX and VIX Rank columns so you can see the volatility environment when each trade was entered. All 91 trades occurred when VIX was below its 70th percentile of the past year.
| # | Ticker | Mkt Cap | Entry | Exit | Shares | Entry $ | Exit $ | P&L | P&L % | Days | VIX | VIX % | Reason |
|---|---|---|---|---|---|---|---|---|---|---|---|---|---|
| 1 | ACHR | $6.5B | 01/16/24 | 01/18/24 | 504 | $4.96 | $5.10 | +$74.99 | 3.00% | 1 | 14.1 | 28 | profit_target |
| 2 | COCO | $3.0B | 01/19/24 | 01/30/24 | 112 | $22.35 | $20.23 | -$237.43 | -9.48% | 10 | 13.8 | 20 | max_hold |
| 3 | DUOL | $6.9B | 01/31/24 | 02/06/24 | 13 | $178.88 | $184.25 | +$69.76 | 3.00% | 5 | 13.4 | 15 | profit_target |
| 4 | SNAP | $12.9B | 02/07/24 | 02/12/24 | 217 | $11.41 | $11.75 | +$74.27 | 3.00% | 4 | 13.1 | 9 | profit_target |
| 5 | DOCU | $11.4B | 02/07/24 | 02/20/24 | 36 | $51.31 | $49.97 | -$47.88 | -2.59% | 12 | 13.1 | 9 | max_hold |
| 6 | PANW | $130.8B | 02/21/24 | 02/22/24 | 18 | $130.98 | $134.91 | +$70.73 | 3.00% | 0 | 15.7 | 54 | profit_target |
| 7 | VSCO | $4.8B | 03/07/24 | 03/08/24 | 138 | $18.01 | $18.55 | +$74.56 | 3.00% | 0 | 14.9 | 50 | profit_target |
| 8 | IMVT | $5.3B | 03/08/24 | 03/13/24 | 79 | $31.69 | $32.64 | +$75.10 | 3.00% | 4 | 14.2 | 41 | profit_target |
| 9 | IMVT | $5.3B | 03/12/24 | 03/13/24 | 60 | $31.50 | $32.44 | +$56.70 | 3.00% | 0 | 15.0 | 52 | profit_target |
| 10 | IMVT | $5.3B | 03/14/24 | 03/19/24 | 83 | $30.69 | $31.62 | +$76.44 | 3.00% | 4 | 13.6 | 21 | profit_target |
Could This Become an Options Strategy?
This is where my mind naturally goes. A few ideas for adapting this to options:
- Selling Puts on RSI Oversold Signals: Instead of buying the stock, sell cash-secured puts on momentum stocks when RSI drops below 30. You'd collect premium and potentially get assigned at a discount.
- Bull Put Spreads: Use the same entry signal but with defined-risk spreads instead of stock positions.
- Covered Call Enhancement: If assigned shares via puts, immediately sell covered calls to generate additional income while waiting for the bounce.
I haven't backtested these options variations yet, but they're on my list. If you're interested in options strategies with documented results, check out my options trading course where I share real-time alerts and complete transparency on every trade.
Final Thoughts
This Momentum RSI backtest shows promise—an 81% win rate, 32% return, and a 2.52 profit factor over two years is solid performance. The VIX Rank filter was the key innovation here, reducing drawdown by 32% while sacrificing minimal returns. But backtests are just the starting point. The real test is live trading with real money, where slippage, emotions, and unexpected events come into play.
I shared this because I enjoy the process of exploring ideas and believe in transparency. Not every backtest I run looks this good, and not every promising backtest translates to live success. But the exploration itself is valuable—and the VIX filter concept could apply to many other strategies.
If you're interested in systematic trading and want to see how I apply similar thinking to my actual options strategies, explore the rest of Options Cafe. I publish all my trades—wins and losses—because real results matter more than theoretical backtests.
Happy trading!
Related Topics: Backtest Results, RSI Strategy, Momentum Trading, Algorithmic Trading, Stock Trading Strategy, Mean Reversion, Swing Trading, Quantitative Trading, Trading Backtest, Systematic Trading, VIX Filter, Volatility Filter