On Friday, October 30, 2026, the VIX said the S&P 500 would move about 1.1%. It dropped 1.8%.
That felt like the VIX got it wrong. It did. But the VIX gets it wrong most days. It just usually misses in the other direction.
So I checked. I compared the VIX expected move to what the S&P 500 actually did for 522 trading days, from October 2024 through October 2026. The market moved more than the VIX expected on only 77 of those days. That's 15%.
That one number explains most of why selling options premium works, and it's the core of what I trade and document in the open. But when I split the data up, I found a second number that matters even more. It shows exactly when the edge disappears. This post walks through both, with the math, the charts, and what I'm taking from it.
- The S&P 500 moved less than the VIX expected on 85% of days. A fair forecast would be 68%.
- Over the last 12 months, option buyers paid for about 40% more movement than they got.
- When the VIX is above 30, that overpricing disappears. That's exactly when premium looks the most tempting.
- The misses are rare but huge. Size every trade for the 3x day, not the average day.
How to Read the VIX as a Daily Expected Move (the Rule of 16)
The VIX is the market's estimate of how much the S&P 500 will move over the next 30 days. Cboe builds it from the prices of S&P 500 options. The catch is that it's quoted as an annual number, which is hard to picture.
Here's the quick fix: divide the VIX by 16. That gives you the market's expected move for a single day. The 16 is roughly the square root of 252, the number of trading days in a year.
| VIX level | Expected daily move | S&P 500 points (at 7,580) |
|---|---|---|
| 12 (sleepy) | 0.75% | ±57 |
| 16 (normal) | 1.00% | ±76 |
| 20 (nervous) | 1.25% | ±95 |
| 25 | 1.56% | ±118 |
| 30 (scared) | 1.88% | ±142 |
| 40 (panic) | 2.50% | ±190 |
A real example: the VIX closed Friday at 19.42. Divide by 16 and Monday's expected move is about 1.2%, or roughly 93 S&P 500 points. That's the Monday before the midterm elections, so it'll be an interesting one to check.
The Test: A Fair VIX Gets Beaten 32% of the Time. This One Got Beaten 15%.
So I ran the test. For every trading day, I took the prior day's VIX close, turned it into an expected move, and checked whether the S&P 500's actual move (up or down) was bigger.
The VIX didn't just miss. It missed in the same direction, over and over. On the median day, the S&P 500 moved less than half of what the VIX had priced in.
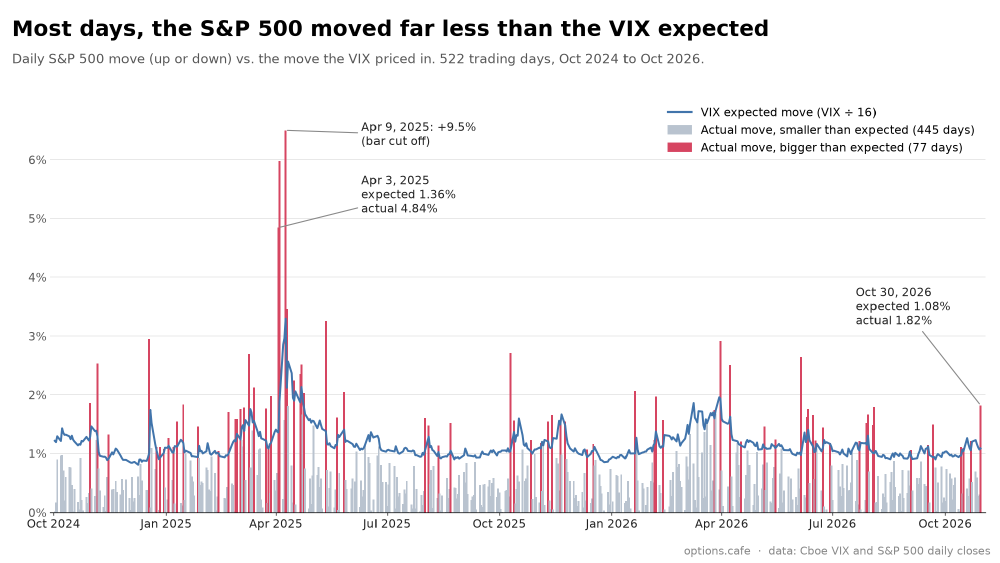
The chart tells the story at a glance. The blue line is what the VIX expected each day. The grey bars are days the market stayed inside that line, and there are a lot of them. The red bars are the 77 days it broke out. Notice they're not spread out evenly. They bunch up, and the biggest ones sit together in April 2025.
Option Buyers Paid for 40% More Movement Than They Got
Here's another way to see the same thing. Over the last 12 months, the VIX averaged 18. If you run the same volatility math on what the S&P 500 actually did, you get 12.8. That second number is called realized volatility. It's the VIX you would have needed to describe the year perfectly.
18 divided by 12.8 is about 1.4. Option buyers paid for roughly 40% more movement than they got.
That gap has a name: the volatility risk premium. And it's the reason selling premium works.
You're not predicting direction. You're selling overpriced insurance.
Think about how a home insurance company makes money. It doesn't know which houses will burn down. It just charges a little more than the claims cost, on average, across thousands of policies. People happily pay that extra because the thing they're protecting against is scary.
Options work the same way. Buyers pay extra for protection against big moves. When I sell a put or a put credit spread, I'm the insurance company. I don't need to know where the market is going. I need the market to move less than the price assumed, which, as the data shows, it does most of the time. That's the whole idea behind my theta gang premium-selling playbook, and it's also why option prices tend to collapse after big events. I break that part down in what IV crush is.
The Surprise: The Edge Disappears When Fear Is Highest
This is the part I didn't expect. I split the 522 days by where the VIX started, and the pattern changed completely as fear went up.
| VIX level | Days | Market beat the VIX | Avg expected | Avg actual |
|---|---|---|---|---|
| Under 15 | 64 | 5 days (8%) | 0.91% | 0.44% |
| 15 to 20 | 343 | 46 days (13%) | 1.08% | 0.56% |
| 20 to 30 | 101 | 20 days (20%) | 1.46% | 0.95% |
| Over 30 | 14 | 6 days (43%) | 2.28% | 2.38% |
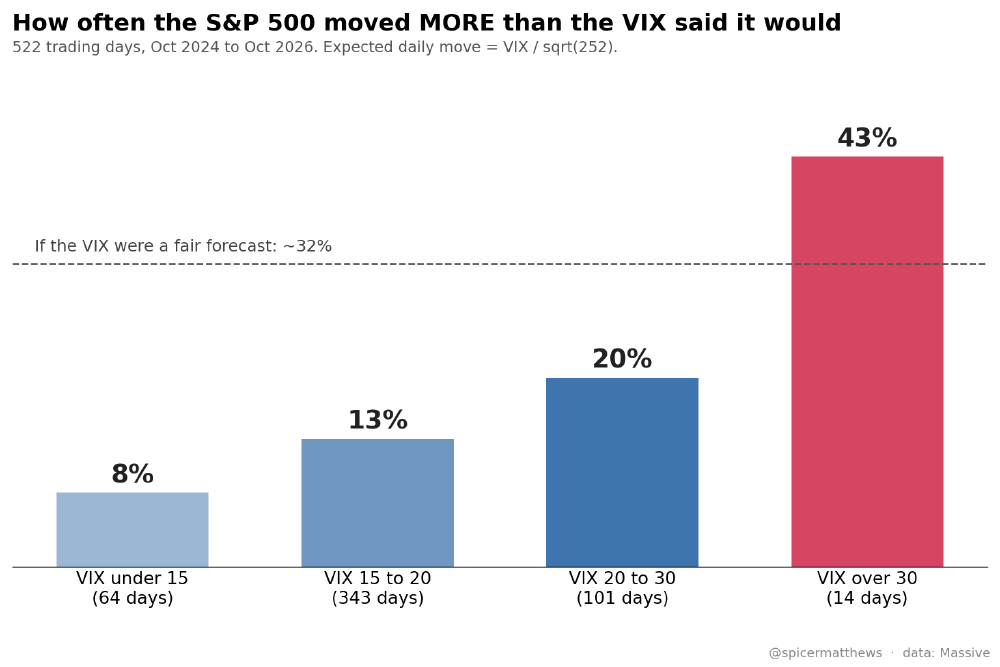
When the VIX was calm, under 15, the market beat its expected move on just 8% of days. As fear rose, that number climbed. And on the 14 days the VIX started above 30, the market beat it 43% of the time. That's worse than a fair forecast.
On those days the average move was 2.38%, against 2.28% expected. The overpricing didn't just shrink. It was gone.
Is This a Two-Year Fluke? I Ran It Back to 1990
Fourteen days is a small sample, so I ran the same test on every trading day since 1990. That's 9,271 days, and it includes 2008, 2020 and 2022.
The headline held up. Over 37 years, the S&P 500 beat the VIX's expected move on 18% of days. Not one calendar year reached the fair-forecast line of 32%. The closest were 2022 at 31.5% and 2008 at 29.6%.
And the pattern by VIX level was the same shape:
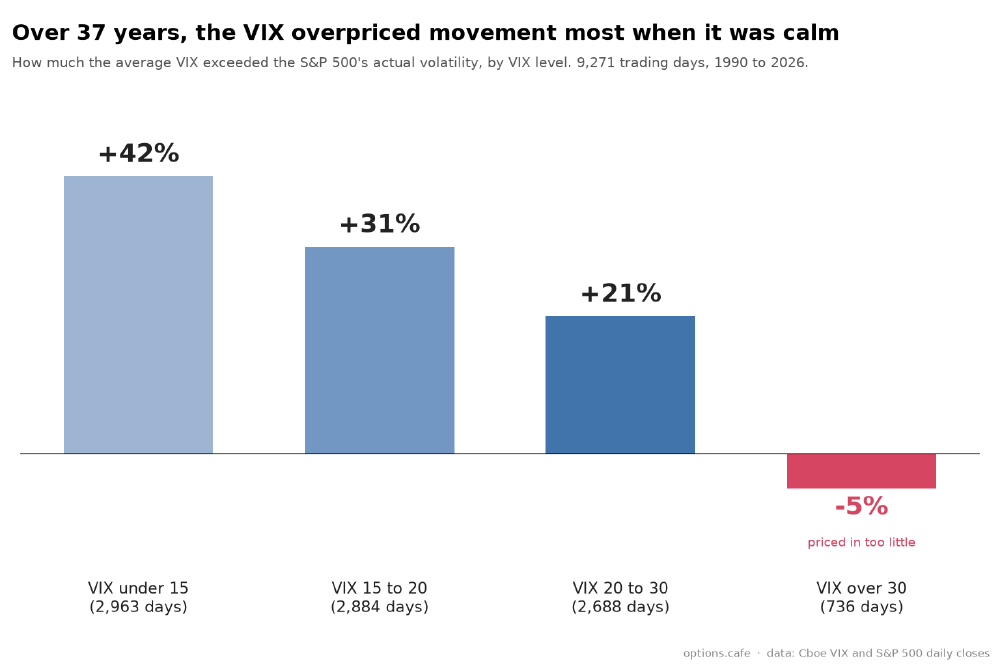
- VIX under 15: the VIX overstated real movement by about 42%.
- VIX 15 to 20: about 31%.
- VIX 20 to 30: about 21%.
- VIX over 30: the VIX was 5% too low. The market moved more than options had priced in.
Two years or 37 years, the answer is the same. The insurance is most overpriced when nobody is scared, and it's fairly priced or cheap when everybody is. In 2008 and 2020, the market's realized volatility for the whole year ran above the average VIX (about 41 vs 33 in 2008, and 34 vs 29 in 2020). Those are the years that break traders who sized for the average day.
The Trap: Premium Looks Fattest Right When It Stops Being Overpriced
When the VIX spikes, every option gets more expensive. The credit on a put spread can double overnight. It feels like the best time to sell. You're getting paid more than you have in months.
But more money isn't the same as a better deal. The data says a high VIX is when you're paid the least for the risk you're taking.
The misses are big, too. Look at April 2025:
- April 3, 2025: the VIX had closed at 21.5 the day before. Expected move: 1.36%. The S&P 500 fell 4.84%, about 3.6 times the forecast.
- April 4, 2025: with the VIX now at 30, the expected move was 1.89%. The S&P 500 fell another 5.97%.
- April 9, 2025: with the VIX at 52, the expected move was 3.3%. The S&P 500 rallied 9.5% on the tariff pause. Big misses go both ways.
That's the shape of this business: small checks most days, and a few days that are 3x. Out of 522 days, the market moved less than half the expected move on 295 of them. Only 8 days moved more than twice the expected move. But those few days carry a huge share of the risk. Measured the way volatility is measured, just 5 days produced about a third of all the market's movement over the two years.
Here's how much one bad month matters. Over the full two years, the VIX averaged 18.4 and the market moved like a 15.9, so options were about 16% overpriced. Take out April 2025, just 21 trading days, and the rest of the period was about 38% overpriced. One month ate more than half of two years of edge. A trader who was oversized going into that month wasn't around to collect the rest. I wrote about what that stretch felt like from the inside in my lessons from the 2025 drawdowns.
What I Take From It
The edge in selling options is real, and you can measure it. The market stayed inside the VIX's expected move on 85% of days over two years. Over 37 years, not one calendar year saw the market beat the expected move as often as a fair forecast would. This isn't a story or a feeling. It's in the data.
It's thinnest exactly when it looks biggest. High VIX means fat premium and the smallest edge. It's also why my zero DTE SPX iron butterfly rules have me sitting out when the VIX is above 25. Those are the days a short-term trade has the least room for error.
Size every trade for the 3x day, not the average day. The average day pays you. The 3x day decides whether you're still trading next year. Before opening a trade, the useful question isn't “what will probably happen?” It's “what happens if the market moves three times the expected move against me tomorrow?” If that answer is a loss you can't absorb, the trade is too big. Defined-risk trades like SPY put credit spreads help because the worst case is known before you click the button. I walk through the sizing math in what size trades to put on with SPY put credit spreads.
If you want a second VIX signal to pair with this one, I found the shape of the VIX curve tells you a lot about when a panic is actually over. That's in my study of VIX contango vs. backwardation.
How I Ran the Numbers
I first shared a shorter version of this as a thread on X. Here's exactly how the numbers were built, so you can check them yourself:
- Data: daily closing values for the Cboe VIX index and the S&P 500 index.
- Expected move: the prior day's VIX close divided by √252 (the “divide by 16” rule).
- Actual move: the S&P 500's close-to-close change, up or down.
- “Beat the VIX”: the actual move was bigger than the expected move.
- Main window: 522 trading days, October 2, 2024 to October 30, 2026. Long window: 9,271 trading days, January 1990 to October 2026.
- “Moved like a VIX of X”: annualized realized volatility of daily S&P 500 returns, so it can be compared directly with the VIX.
And the limits worth knowing:
- The VIX is a 30-day forecast, not a one-day forecast. Dividing by 16 assumes the risk is spread evenly across those days. It isn't. Days with a Fed decision, a jobs report or an election carry more of it.
- Closing prices hide intraday swings. A day that drops 3% and recovers by the close shows up as a small move here. A short-dated option seller still felt that drop.
- You can't sell the VIX itself. Real trades pay bid/ask spreads and commissions, and the strike you sell may be priced richer or cheaper than the VIX suggests.
- Two years is short, and most of it was a bull market. The 1990 check helps, but past results are not a promise about the future.
- Not investment advice. This is educational analysis of historical data.
VIX Expected Move: Frequently Asked Questions
How do you calculate the expected move from the VIX?
How often does the S&P 500 move more than the VIX predicts?
Is the VIX usually too high?
What is the volatility risk premium?
Is a high VIX a good time to sell options premium?
The Bottom Line
Friday's 1.8% drop felt like the VIX got caught off guard. In a way it did. But step back and the bigger story runs the other way: most days, the VIX expects far more movement than the market delivers. That gap is real, it's measurable, and it's the reason premium sellers get paid.
The catch is when it shows up. The overpricing is biggest when the market is calm, and it vanishes right when the VIX spikes and premium looks the most tempting. So collect the small checks, but build every position to survive the 3x day.
If you want to see how I put this into practice, including the trades that lost money, start with how I sell premium. Course members also get a real-time alert every time I open or close a trade, so you can watch these rules play out live.
Ready to learn options trading?
Start learning how to successfully trade options to earn monthly income.
Related Topics: VIX Expected Move, VIX Rule of 16, Implied vs Realized Volatility, Volatility Risk Premium, Selling Options Premium, Theta Gang, S&P 500 Daily Move, VIX, Position Sizing, Options Trading