The VIX term structure is one of the most useful — and most misunderstood — signals in the market. It compresses the market's entire mood into a single number, and when that number flips, traders panic, sell, or try to be a hero and catch the falling knife. After studying 17 years of data, I can tell you the most common reaction is also the most expensive one.
Here is the punchline up front: when the VIX term structure flips from contango into backwardation, don't buy the panic — buy the relief. That flip from contango (calm) to backwardation (panic) is the whole signal. Buying the moment fear spikes is a coin flip. Waiting for fear to resolve turned that coin flip into an 88% bet in just five trading days. Let me show you exactly what that means and how the data backs it up.
What the VIX Term Structure Actually Is
The VIX term structure is the relationship between the 30-day VIX and the 3-month VIX3M. When VIX3M is higher (the curve slopes up) the market is in contango — calm. When the near-term VIX spikes above VIX3M (the curve inverts) the market is in backwardation — panic. That single flip from contango to backwardation is the signal this whole study is built on.
Most traders watch a single VIX number. The term structure is better, because it compares two fear gauges instead of one:
- VIX — the market's expected S&P 500 volatility over the next 30 days, quoted annualized.
- VIX3M — the exact same expectation, but over the next 3 months.
The relationship between those two numbers is the entire story.
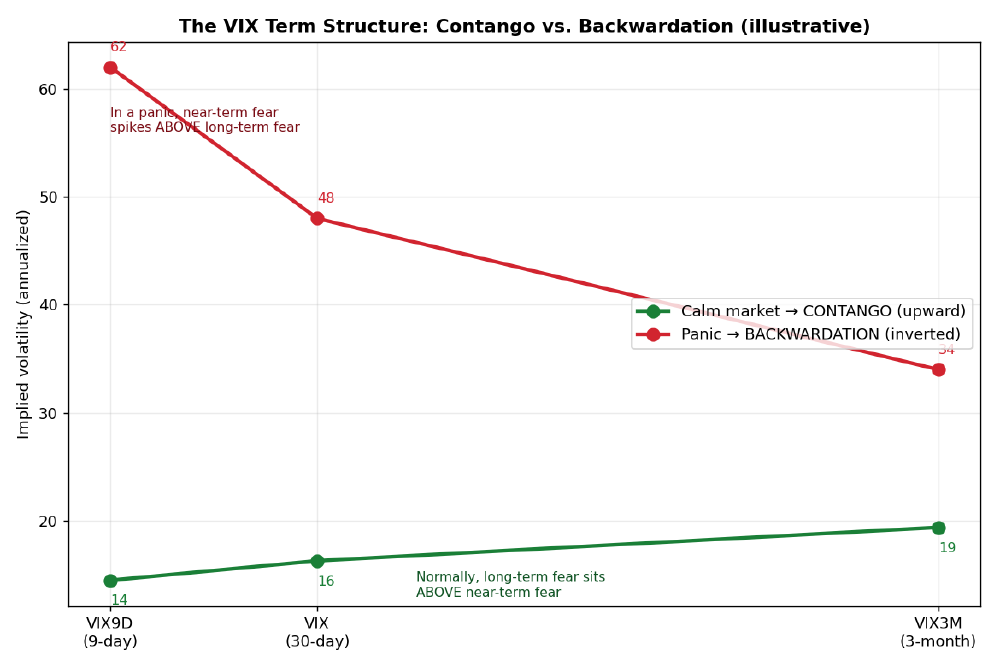
- Contango (calm, normal): longer-term fear sits above near-term fear (VIX3M > VIX). The curve slopes up. This makes intuitive sense — tomorrow is fairly knowable, but three months out is murky.
- Backwardation (panic): near-term fear spikes above longer-term fear (VIX > VIX3M). The curve inverts.
The One Number to Watch: VIX ÷ VIX3M
You do not need to eyeball a curve. Just divide the two:
- Below 1.0 = contango (calm). Long-term fear is winning.
- Above 1.0 = backwardation (panic). Near-term fear is winning.
Two real examples make it concrete:
- Calm (today, June 1, 2026): VIX 16.05 ÷ VIX3M 19.43 = 0.83 → contango. Business as usual.
- Panic (COVID peak, Feb 28, 2020): ratio 1.34 (VIX 40.1 ÷ VIX3M 29.9). A few weeks later, on March 16, 2020, the VIX itself closed at 82.7 — the modern record.
VIX History: Two Decades of Fear Spikes (2005–2026)
Before we dig into the term structure, it helps to see the raw VIX level over the long haul. The VIX itself goes back to 1990, so this view includes 2008.
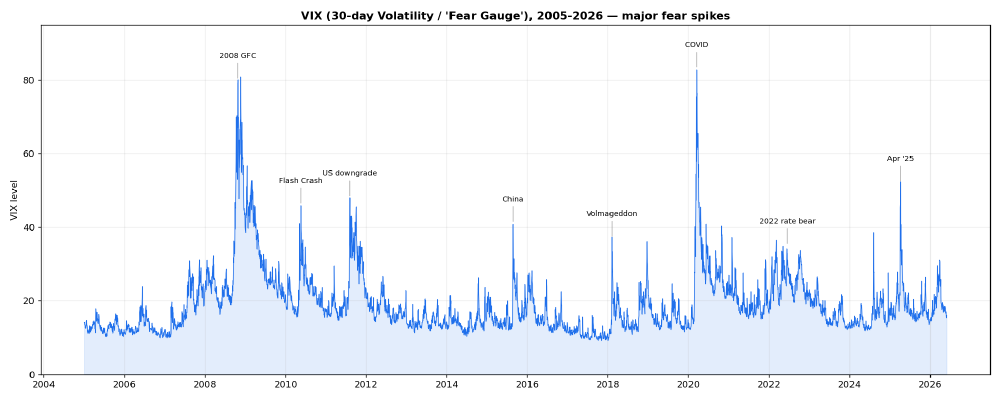
The major fear spikes of the last two decades:
- 2008 Global Financial Crisis — VIX peaked around 80 (Nov 2008). The defining panic of the era.
- 2010 Flash Crash — VIX ~46.
- 2011 US debt downgrade / EU crisis — VIX ~48.
- 2015 China devaluation — VIX ~41.
- 2018 “Volmageddon” — VIX ~37, a violent short-volatility unwind, plus the Q4 2018 selloff.
- 2020 COVID crash — VIX closed 82.7 on 3/16/2020, the modern record.
- 2022 rate/inflation bear — elevated (~30s) but no single spike; a slow grind.
- April 2025 — VIX ~52 on the tariff shock.
Backwardation Through the Cycle — and What the Market Did Next
Here is the heart of the study. The top panel is VIX ÷ VIX3M, shaded red wherever it crossed into backwardation. The bottom panel is the S&P 500, with the same red days highlighted.
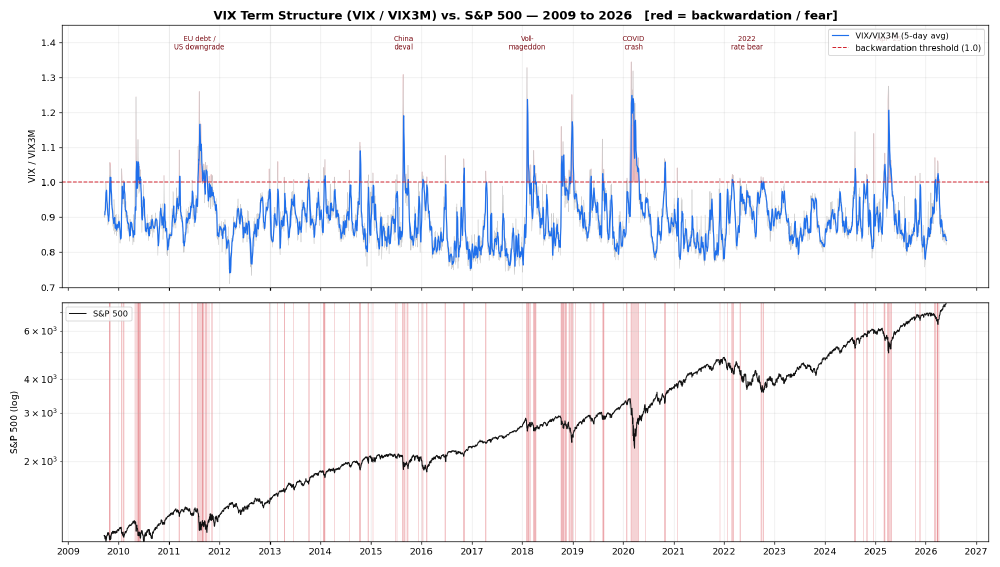
Since September 2009 there have been 43 backwardation episodes, and backwardation was present on only 7.7% of all trading days. This is a rare alarm, not a daily dial. The longest episodes — and what the S&P did during each one, from onset to resolution — look like this:
| Episode | Days in backwardation | S&P during |
|---|---|---|
| 2020 COVID (Feb 24 – Apr 23) | 43 | −13.3% (worst point −30.6%) |
| 2011 EU debt / US downgrade (Jul 27 – Sep 13) | 34 | −10.1% |
| 2018 Q4 selloff (Oct 10 – Nov 20) | 30 | −5.2% |
| 2010 flash-crash period (May 6 – Jun 8) | 23 | −5.9% |
| 2018 December (Dec 6 – Jan 3) | 19 | −9.2% |
| 2025 spring (Mar 31 – Apr 24) | 18 | −2.3% |
Bull-Market Backwardation Looks Nothing Like Bear-Market Backwardation
This is the part that trips people up. In the 2023–2026 bull market, every red spike was a quick dip that V-recovered. In a real bear (2008, 2020), backwardation persisted — COVID stayed inverted for 43 straight days while the S&P fell as much as 34%. Buying the first red day meant weeks more pain — the kind of experience I wrote about candidly in what I learned from my 2025 trading drawdowns.
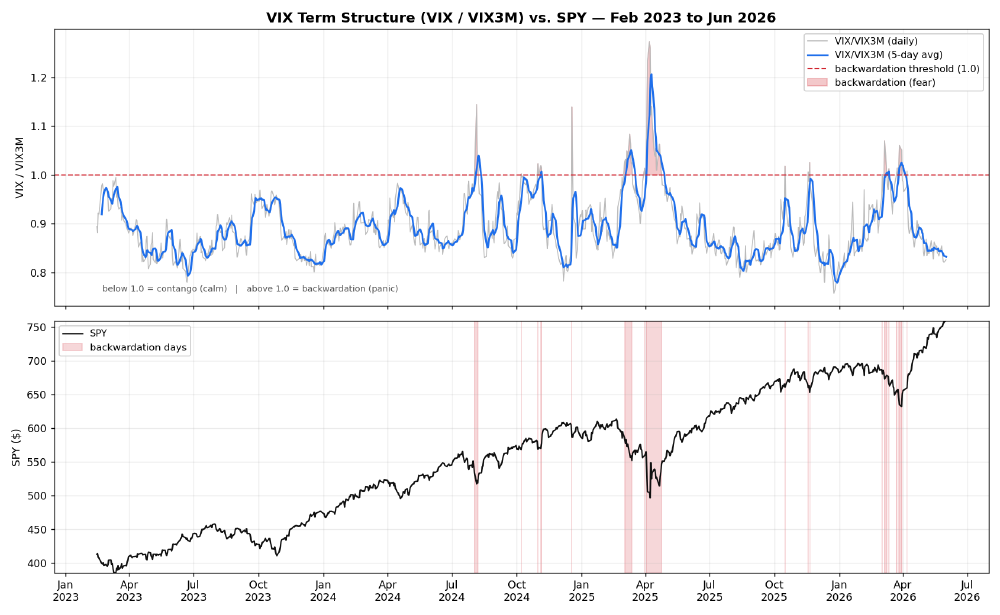
You can see it clearly in the close-up above: short, sharp inversions that snapped right back. The lesson is not “backwardation means buy” or “backwardation means sell” — it's that the duration of the inversion tells you whether you're in a dip or a crash, and you don't know which until it resolves.
The Three Playbooks
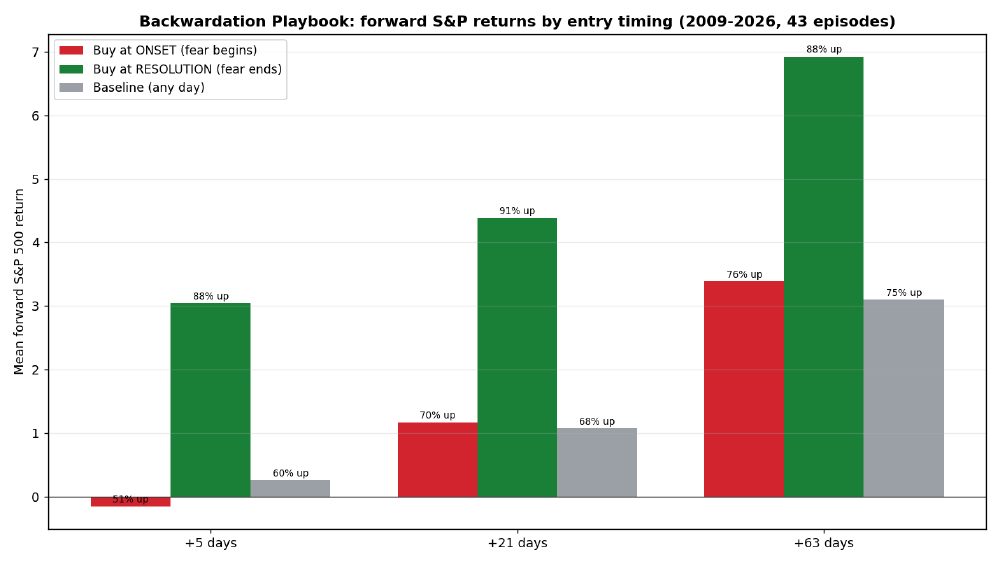
Here is where the data earns its keep. I tested what the S&P 500 did from three different moments, across all 43 episodes. “Forward return” is the mean return, paired with how often it was positive.
| Entry timing | +5 days | +21 days (~1 mo) | +63 days (~3 mo) |
|---|---|---|---|
| A) Buy at ONSET (ratio crosses above 1.0) | −0.15% · 51% up | +1.17% · 70% up | +3.39% · 76% up |
| B) Buy at RESOLUTION (ratio crosses back below 1.0) | +3.04% · 88% up | +4.38% · 91% up | +6.93% · 88% up |
| Baseline (any random day) | +0.26% · 60% up | +1.07% · 68% up | +3.10% · 75% up |
Playbook A — Buy the onset. This is the “catch the falling knife” trade. At five days it's a coin flip (51% up, slightly negative on average). Even at one to three months it only matches a random day. There is no edge here — just real near-term pain. In fact, during backwardation the market kept falling 74% of the time (avg −2.0%, worst −30.6% in COVID). Onset is a de-risk signal, not a buy signal.
Playbook B — Buy the resolution. Wait for the storm to pass — for the term structure to flip back into contango — and then buy. This produces a strong, broad-based edge at every horizon, with an 88–91% hit rate. And the medians (+3% to +7%) confirm this is the typical case, not one COVID outlier dragging up the average. This is roughly 2–4× the baseline. It is the single most repeatable edge in the entire study.
Playbook C — Short the panic. The “other side” trade. During backwardation the S&P fell in 74% of episodes — but only −2.0% on average (−1.2% median). The worst drawdown from onset averaged −3.6% and reached −30.6% in COVID. So shorting at onset and covering at resolution wins about three times out of four, but it's tail-hunting: the payoff lives in the rare big crashes, the typical episode is small, and the ~26% that bottom before resolving will squeeze you (you're shorting after a drop has already started). If you want to understand why fading volatility is so seductive and so dangerous, I wrote about that mindset in thinking differently about volatility trading.
How to Trade VIX Backwardation: Buy the Relief, Not the Panic
If you remember one sentence from 17 years of data, make it this one:
Waiting for VIX ÷ VIX3M to cross back below 1.0 — instead of buying the moment it inverts — was worth roughly +3% and turned a coin flip into an 88% bet, in just the first five days.
Here is the concrete playbook I'd describe to any trader:
- Onset (ratio crosses above 1.0): de-risk. Trim or hedge longs. Do not buy. (Aggressive traders only: a small tactical short, understanding the payoff is fat-tail-driven.)
- During: wait. Don't try to be a hero catching the exact bottom.
- Resolution (ratio crosses back below 1.0): buy. This is the high-probability entry. Hold roughly 1–3 months — the snap-back is fastest in the first one to two weeks, but the edge keeps compounding out to three months with no sign of reversing, so your exit can follow your own style.
Why is “short the other side” the weakest of the three? Because the asymmetry — many small declines plus a few enormous ones — combined with squeeze risk on early bottoms makes it lower-quality than simply de-risking at onset and re-deploying at resolution. De-risking captures most of the same benefit with far less risk. It also pairs naturally with selling premium into the elevated volatility, which I cover in my SPY put credit spread strategy.
Caveats and Honest Limitations
I'd be doing you a disservice if I sold this as a holy grail. It isn't. Keep these front of mind:
- Modest sample: 43 episodes. Several aggregate stats are influenced by the big tails (COVID, 2011, 2018 Q4).
- Bull-market bias: 2009–2026 was a secular bull, so every resolution was eventually followed by an up-market. In a true secular bear, resolutions could be false dawns.
- 2008 is not in the term-structure analysis — VIX3M data starts September 2009 (shown via VIX level only).
- The 2022 blind spot: the term structure barely inverted in the 2022 bear. This signal does not catch slow, grinding declines. For context on how often the market drops hard, see how often the SPY falls more than 5% in a 30-day period.
- No hindsight in the real-time rule: episodes here merge spikes separated by fewer than five days, so “resolution” is confirmed after the fact. The clean, tradeable version is “buy when the 5-day-average VIX ÷ VIX3M crosses back below 1.0” — slightly noisier, but with no look-ahead. The edge survives it.
- Not investment advice. This is educational analysis of historical data. Past performance is not a guarantee of future results.
VIX Term Structure FAQ
What is backwardation in the VIX?
VIX backwardation is when the 30-day VIX rises above the 3-month VIX3M, inverting the term structure. It signals that traders fear the next few weeks more than the next few months — a sign of acute, near-term panic. It happens on only about 7.7% of trading days.
What is the difference between contango and backwardation?
In contango, longer-dated volatility (VIX3M) is higher than near-term volatility (VIX), so the curve slopes up — the normal, calm state. In backwardation, near-term volatility spikes above longer-dated volatility, inverting the curve. Contango is business as usual; backwardation is the market screaming about a storm right now.
How do you calculate the VIX term structure?
Divide the VIX by the VIX3M. A ratio below 1.0 means contango (calm); a ratio above 1.0 means backwardation (panic). For example, VIX 16 ÷ VIX3M 19 = 0.83, which is contango.
Is VIX backwardation bullish or bearish?
Across 17 years of data, the onset of backwardation was not a buy signal — the market kept falling 74% of the time. The bullish edge showed up at the resolution: buying when the ratio crossed back below 1.0 was positive 88% of the time over the next five days.
Putting the VIX Term Structure Signal to Work
The VIX term structure won't catch every bear, and it won't fire often — backwardation shows up on fewer than one in twelve trading days. But when it does invert, it hands you a simple, repeatable decision tree: de-risk at the onset, wait through the storm, and buy the relief. That single discipline — refusing to buy the panic and instead buying the all-clear — was worth multiples of the market baseline over 17 years, and it kept traders out of the worst weeks of every crash.
If you want to learn how to translate signals like this into actual income-generating options trades — selling premium into elevated volatility, structuring spreads, and managing risk through the panic — that is exactly what I teach at Options Cafe. The market will keep handing you storms. Your job is to wait for the clearing skies.
Ready to learn options trading?
Start learning how to successfully trade options to earn monthly income.
Related Topics: VIX Term Structure, Contango vs Backwardation, VIX Backwardation, Contango, VIX3M, Volatility Trading, Market Timing, S&P 500 Volatility, VIX Indicator, Options Trading