Search "zero DTE iron butterfly" and the first thing you'll find is Investopedia's textbook definition. Search a little harder and you'll find tastylive backtests, a few YouTube videos, and a lot of generic "advanced options strategy" listicles. What you won't find is a trader publishing every single iron butterfly trade — wins, losses, sizing, and adjustments — with two years of real money behind it.
I do that out in the open. From January 2024 through October 2025, I placed 254 zero DTE SPX iron butterflies with my own capital. In 2024 the strategy returned 431% on the test account I run it in — $5,079 of profit on 168 trades with a 77% win rate. In 2025 it gave back $5,472 in just 86 trades, even with a 78% win rate. Net result over the two years: roughly flat, with a stomach-churning 12 months in the middle.
This is the post I wish someone had written before I started. The mechanics, the entry rules, the position sizing, the math, and — most importantly — the honest story of what happens when a strategy that "always works" stops working. If you have a $50K+ account, an appetite for advanced strategies, and the discipline to follow rules, this is the most complete guide you'll find. If you're new to options, bookmark it and come back after you've run the wheel for a year.

What Is a Zero DTE SPX Iron Butterfly?
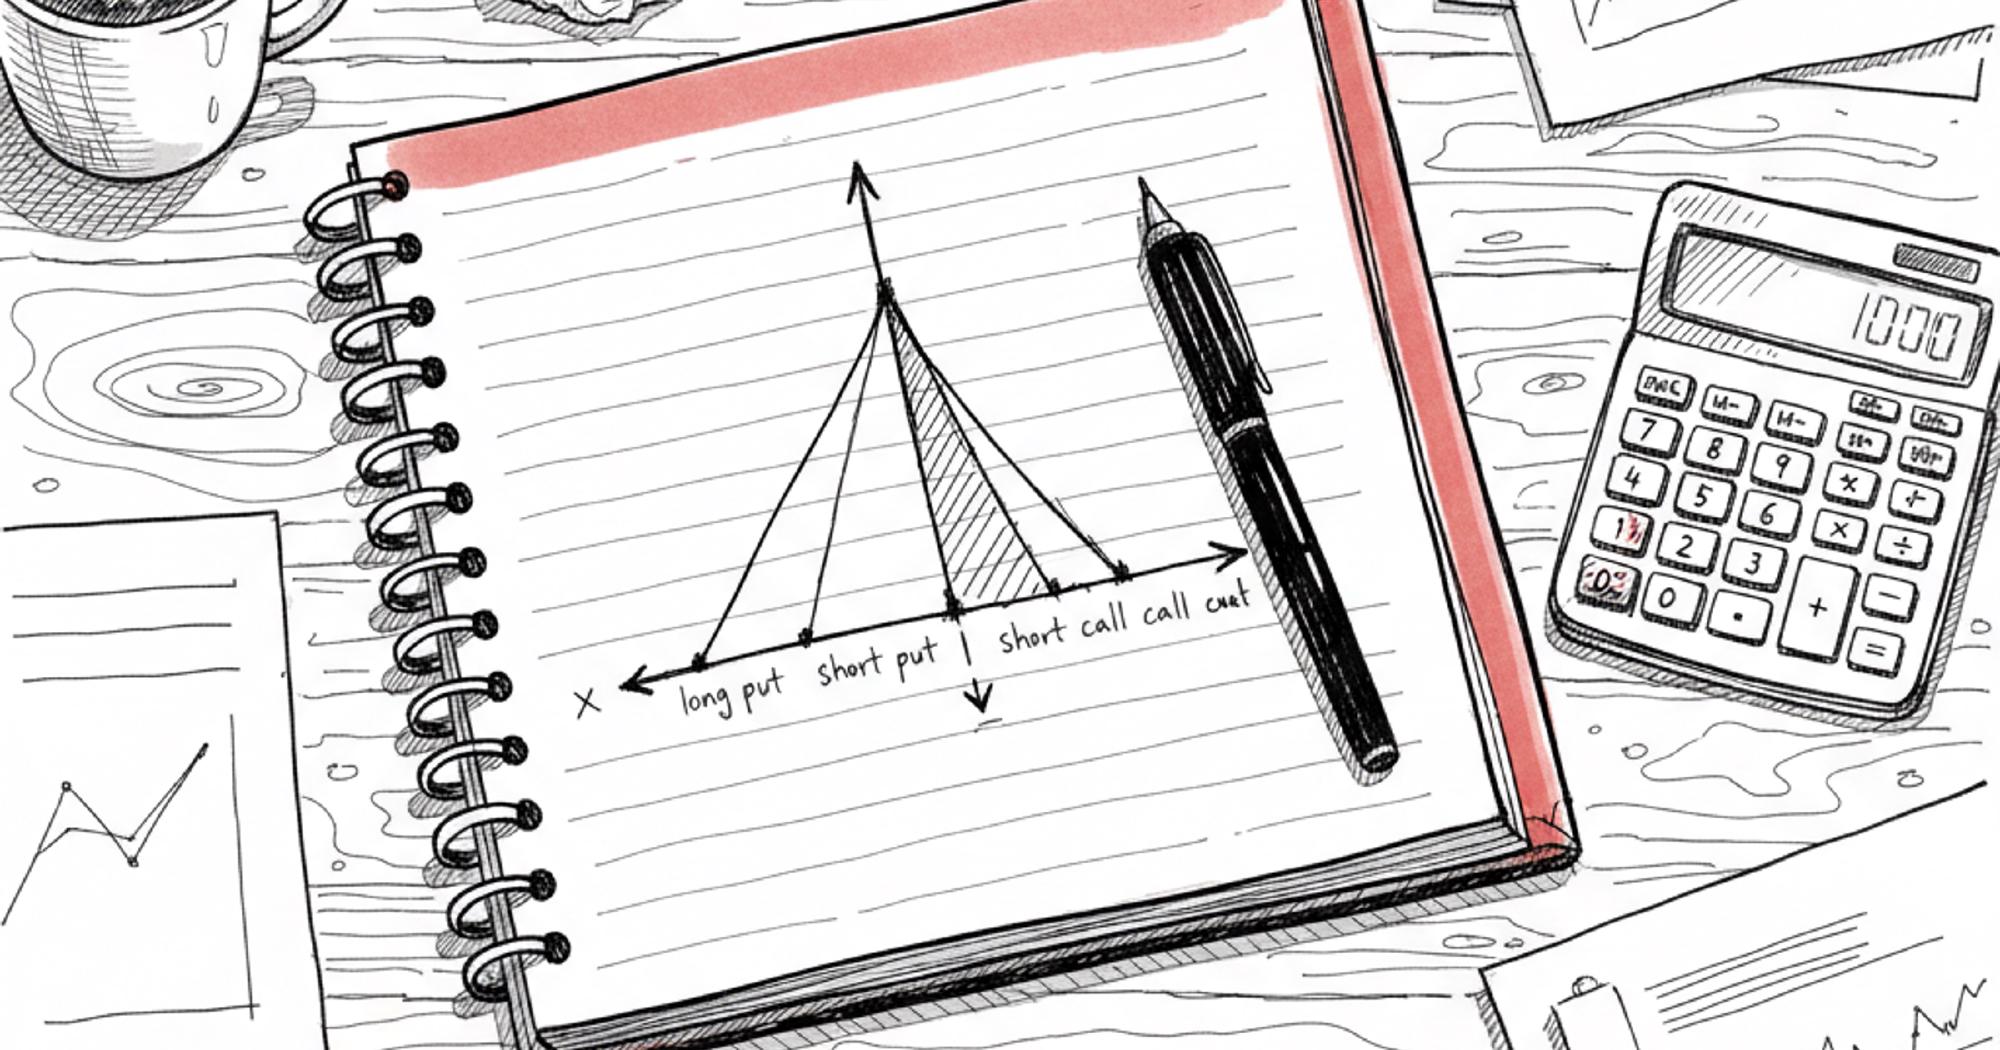
An iron butterfly is a four-legged options structure built from two credit spreads — a short call spread and a short put spread — sharing the same short strike. You sell an at-the-money call and an at-the-money put, then buy a further-out-of-the-money call and put as "wings" to define your risk. Net, you collect a credit. You want the underlying to pin at the short strike at expiration.
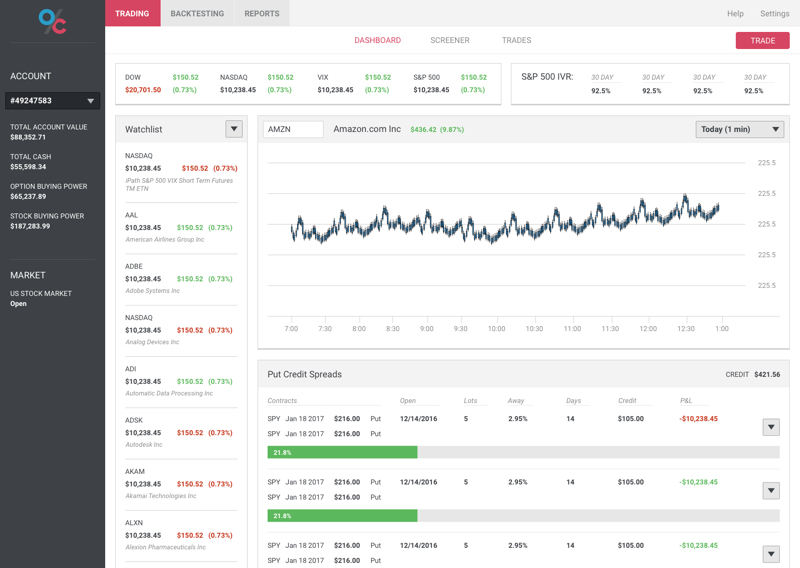
"Zero DTE" means zero days to expiration — the options expire today. "SPX" is the cash-settled S&P 500 index option. Combine the three pieces and you get a strategy where you open a trade in the morning that's either dead money or worth full intrinsic value by 4:15pm ET the same day. No overnight risk. No assignment risk. Just a four-hour window where you're betting SPX won't move too far from where you opened.
The Structure (with real numbers)
- Sell 1 SPX call at the at-the-money strike (e.g., 5,500)
- Sell 1 SPX put at the same at-the-money strike (5,500)
- Buy 1 SPX call 30 points up as a wing (5,530)
- Buy 1 SPX put 30 points down as a wing (5,470)
Net credit on a 30-point-wide butterfly: typically $15-$22 per contract ($1,500-$2,200 in real dollars, since SPX has a 100x multiplier). Max loss: the wing width minus the credit. On a 30-wide fly with a $20 credit, max loss is $1,000. That's your defined risk.
The strategy makes money when SPX closes inside your "tent" — the range between the wings. It makes maximum profit if SPX pins at the short strike at 4:00pm ET. It loses money when SPX punches outside the wings.
Why Zero DTE? Why SPX?
Most iron butterfly tutorials use 30-45 day expirations. I trade them same-day. Three reasons.
1. Theta decay is non-linear in the final hours
An at-the-money option loses extrinsic value slowly for most of its life and then collapses in the final 4-6 hours. Selling premium at 9:45am ET on a 4:15pm-expiry option means you're capturing the steepest part of the theta curve. Every minute SPX doesn't move, money flows to you faster than at any other point in the option's life.
2. SPX is cash-settled and tax-advantaged
SPX options never get assigned to shares. They cash-settle at expiration. That removes a huge operational headache compared to SPY-equivalent strategies. SPX options also receive Section 1256 tax treatment — 60% long-term capital gains, 40% short-term — regardless of how long you held them. For a strategy that holds positions for hours, the tax difference is substantial. (I cover this in more depth in my options trading taxes guide.)
3. SPX has the deepest liquidity in the world
Penny-wide bid/ask spreads on at-the-money options. You can trade size without moving the market. Slippage on a 1-lot is negligible. For 0DTE, where every dollar of slippage hits a small-credit trade, this matters.
If you want a deeper comparison of SPX vs SPY for index trading, I wrote a full breakdown here.
My Exact Entry Rules
Mechanics matter less than rules. I follow the same six rules every trading day. They're not magic — I tested several variations and these were the best fit for my account size, schedule, and risk tolerance.
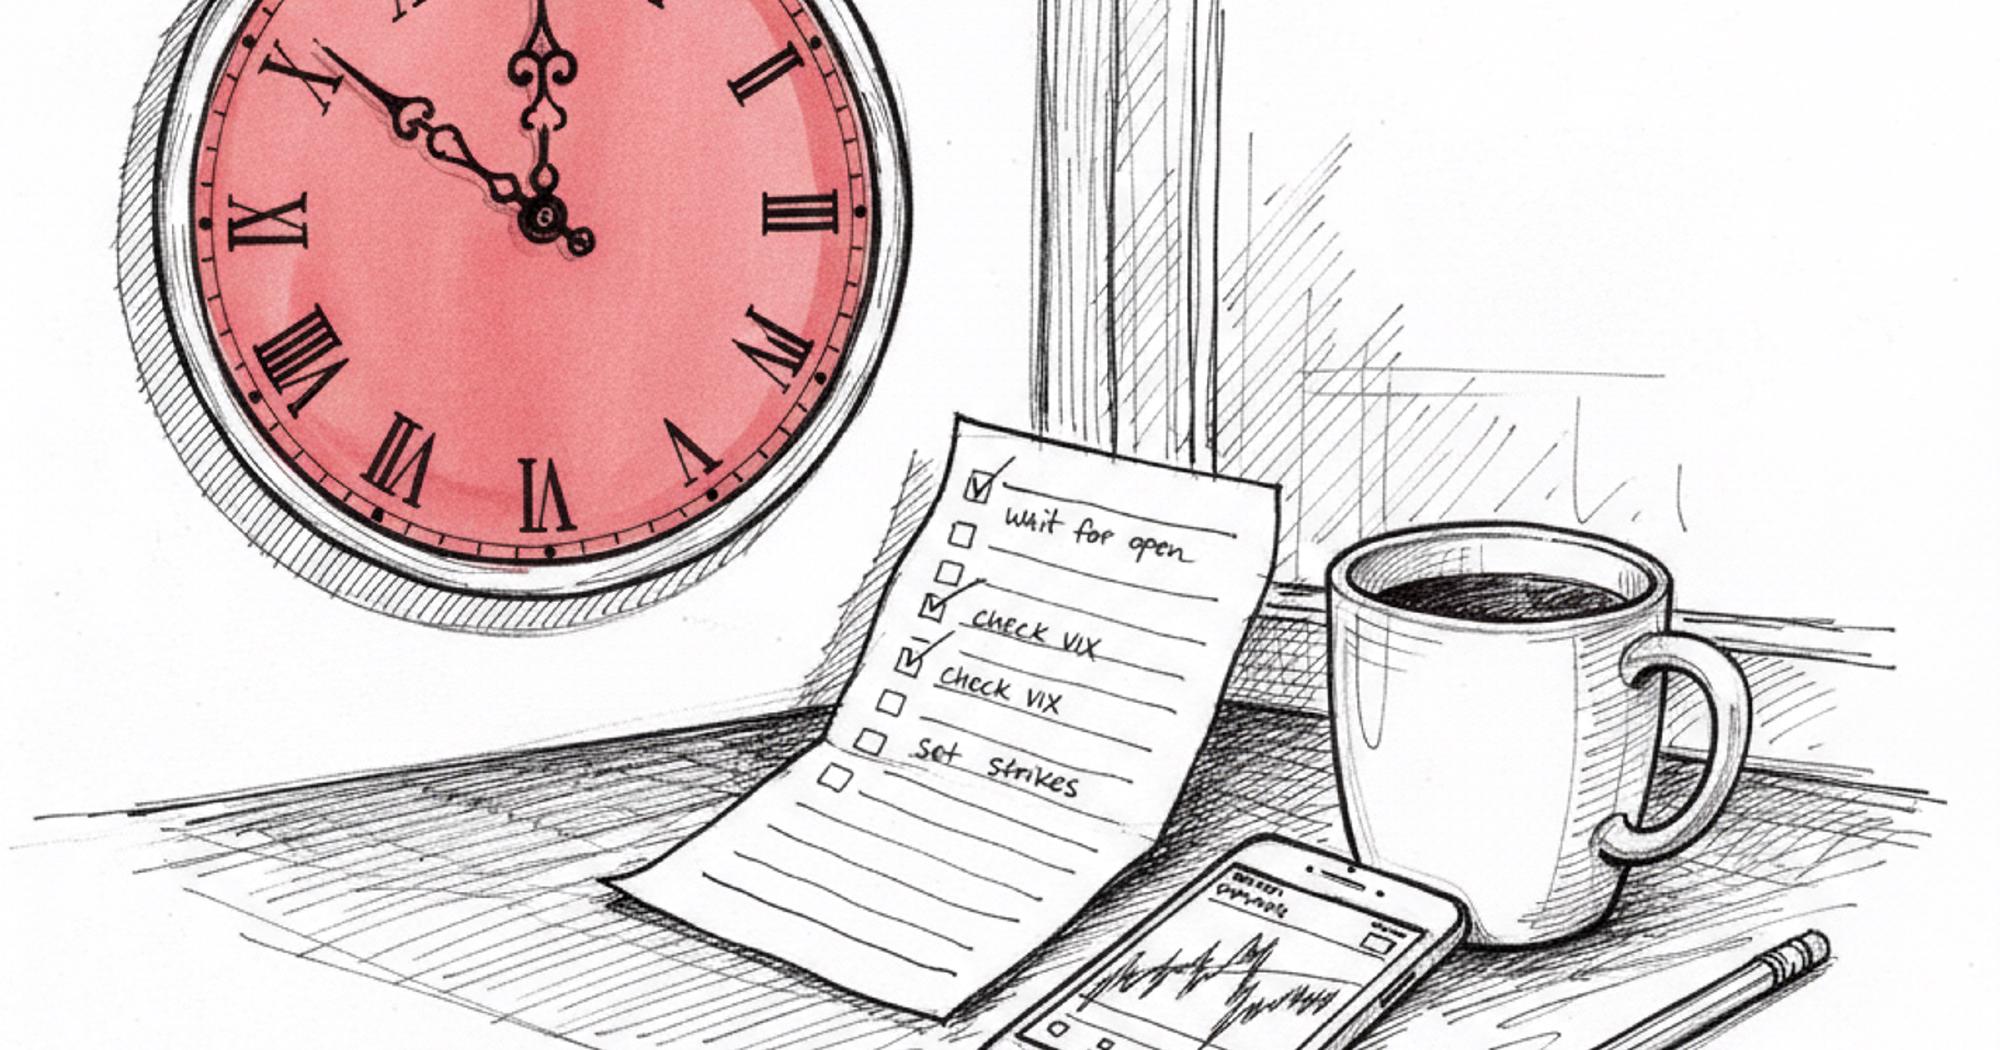
- Wait until 9:45am ET to enter. The first 15 minutes of trading is a liquidity-discovery period. Spreads are wide, prints are erratic, and the opening auction can fake out a butterfly center strike. I wait.
- Center the fly at the current SPX price. Round to the nearest 5-point strike. If SPX is 5,503, my short strikes are 5,505. Simple.
- Use 30-point wings (60-point total width). Wider wings = bigger credit but bigger max loss. Tighter wings = smaller credit but limited downside. 30 points has been my sweet spot on SPX for the last two years.
- Only trade if the credit is at least 50% of max profit. A 30-wide fly has a max profit of $30 per contract. If I can't collect at least $15, the risk/reward isn't worth it that day. This filters out low-vol days.
- Position size: 1 contract per $6,000 of account. Max risk per trade is roughly $1,000. That keeps single-trade risk under 17% of the test account.
- Set a stop at 2x credit collected. If I collected $1,500, I exit when the position is down $3,000. This is the most important rule and the one I broke most in 2025. More on that below.
The 2024 Results: $5,079 Profit, 77% Win Rate
I started running this strategy in January 2024 on a dedicated $6,000 test account. The goal was simple: see if a mechanical, rules-based 0DTE butterfly could produce a consistent return without me needing to "read" the market. 168 trades later, the answer in 2024 was yes.
| Month | P&L | Trades | Win Rate |
|---|---|---|---|
| January 2024 | -$2,976.80 | 12 | 58% |
| February 2024 | +$3,335.96 | 17 | 82% |
| March 2024 | +$2,219.80 | 16 | 75% |
| April 2024 | +$388.24 | 12 | 75% |
| May 2024 | +$954.00 | 15 | 80% |
| June 2024 | -$1,830.84 | 7 | 29% |
| July 2024 | +$1,239.80 | 15 | 80% |
| August 2024 | +$4,773.68 | 21 | 95% |
| September 2024 | -$5,605.80 | 6 | 33% |
| October 2024 | +$463.32 | 19 | 84% |
| November 2024 | +$868.84 | 14 | 86% |
| December 2024 | +$1,249.04 | 14 | 79% |
| 2024 Total | +$5,079.24 | 168 | 77% |
$5,079 on a $6,000 account is an 85% return on starting capital — or 431% annualized if you reinvest the gains (I didn't; I kept the test account at $6,000 to make the math comparable month-to-month). Even accounting for the rough patches in January, June, and September, the year worked. The 95% win-rate August was the kind of month that makes you think the strategy is unbeatable. It wasn't.
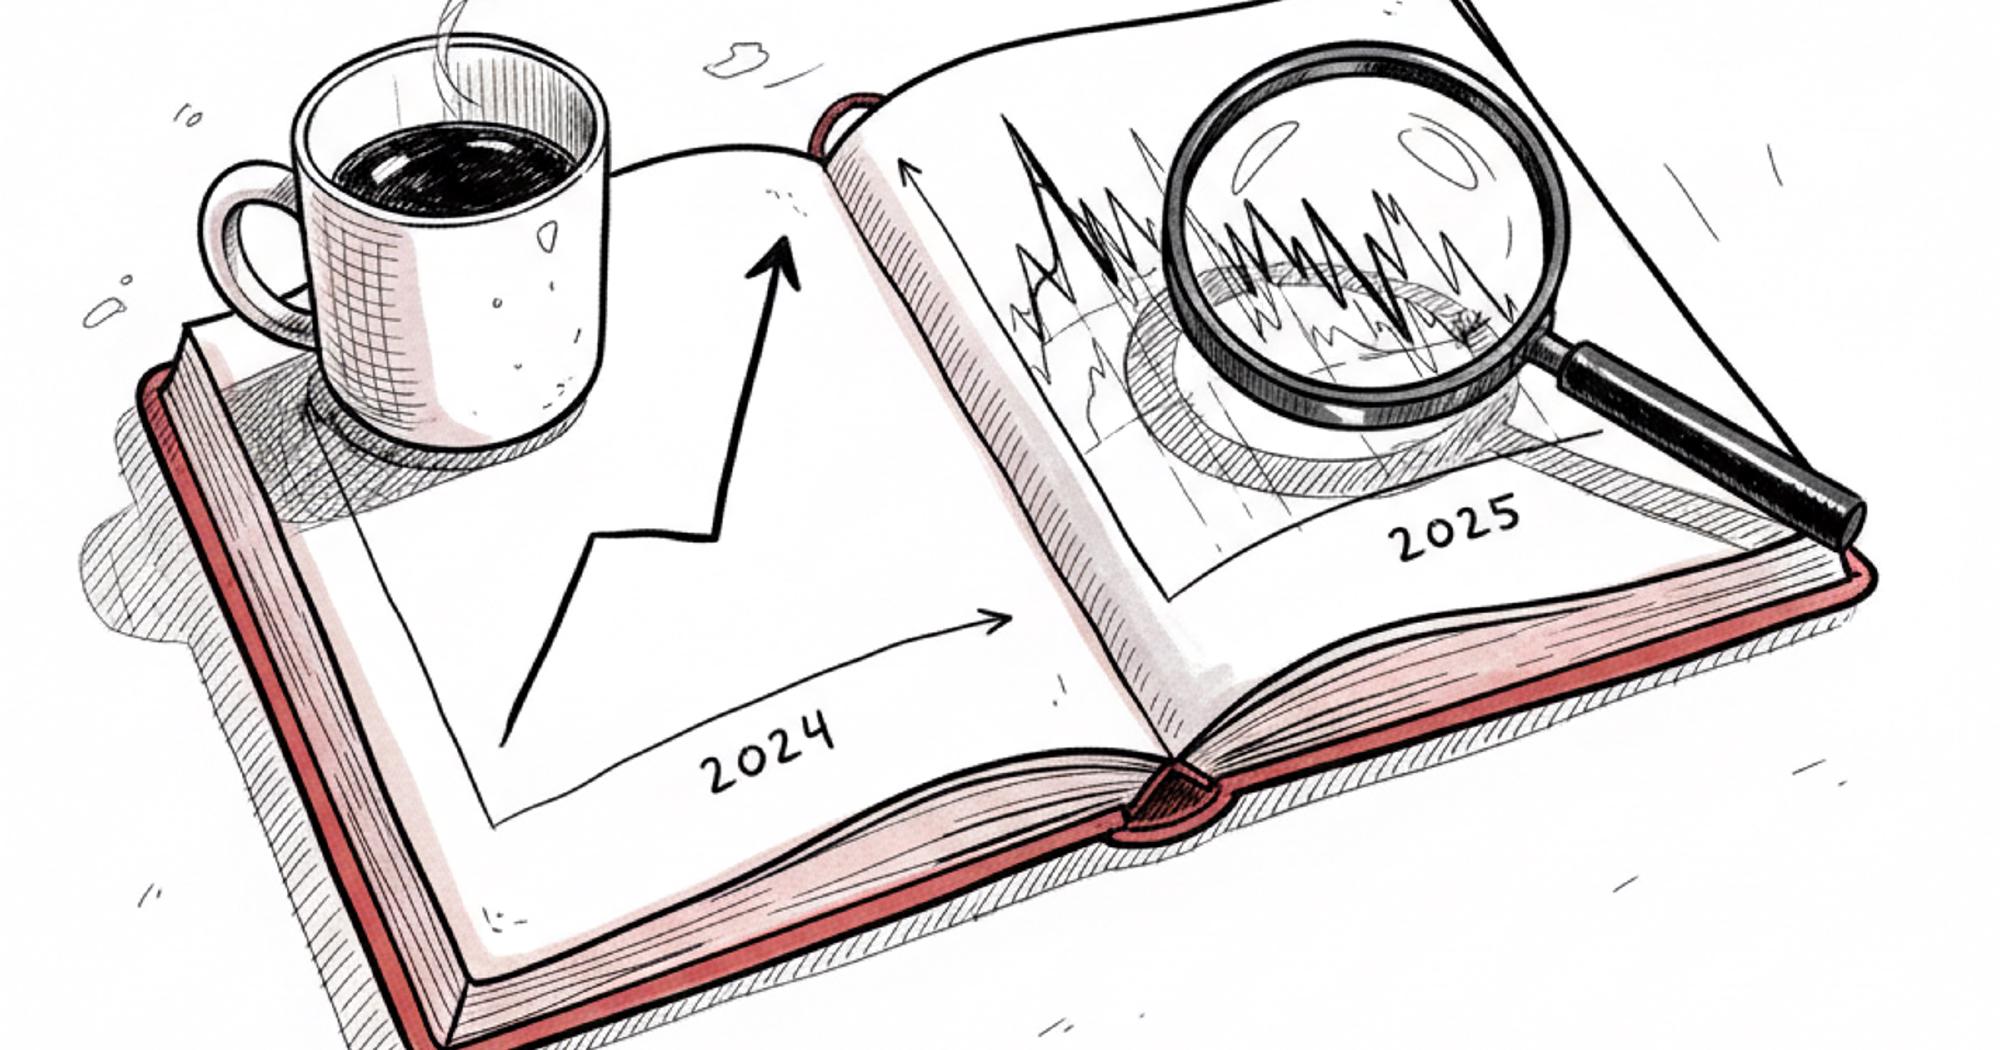
The 2025 Story: What Happens When It Stops Working
January 2025 opened with one trade I'll remember for a while. SPX gapped down on a tariff headline, ripped back through my short strikes mid-morning, and I held past my stop "because the position would recover by 2pm." It didn't. One trade — minus $5,000+. Eight total trades in January for a net -$5,381. The annual P&L was effectively decided in the first 30 days.
| Month | P&L | Trades | Win Rate |
|---|---|---|---|
| January 2025 | -$5,381.12 | 8 | 38% |
| February 2025 | +$38.48 | 11 | 82% |
| April 2025 | +$315.84 | 1 | 100% |
| May 2025 | -$1,618.48 | 10 | 80% |
| June 2025 | +$476.52 | 10 | 90% |
| July 2025 | +$1,004.64 | 8 | 63% |
| August 2025 | +$1,036.56 | 18 | 89% |
| September 2025 | -$307.00 | 17 | 82% |
| October 2025 | -$1,037.44 | 3 | 67% |
| 2025 Total | -$5,472.00 | 86 | 78% |
Look at that win rate: 78% in 2025 vs 77% in 2024. The mechanical strategy was still winning about 4 out of every 5 trades. What changed?
What changed: the size of the average loser
In 2024, my average losing trade lost about $800. My average winner made about $200. With a 77% win rate, the math worked: 100 trades × (0.77 × $200 + 0.23 × -$800) = $15,400 expected gain. Reality came in below that because some losers blew through my stop, but the framework held.
In 2025, my average losing trade ballooned to roughly $1,500. The Trump-administration tariff headlines created an entirely different intraday volatility regime — SPX would trade in a tight 0.3% range for hours, then make a 1.5% move in 20 minutes on a single news event. Iron butterflies hate those moves. Even with the same 78% win rate, the math flipped: 100 trades × (0.78 × $200 + 0.22 × -$1,500) = -$174 expected loss per 100 trades.
What changed: my discipline
Two years of 77% wins teaches you bad habits. When January 2025 punched a hole in the account, I started skipping stops. "I've seen this before. It'll bounce." Sometimes it did. Sometimes — like January 14 — it didn't. The trade count drops in 2025 because I started cherry-picking days, which is just another way of saying I lost my mechanical edge. Cherry-picking with a coin flip is still a coin flip.
What changed: the market regime
An iron butterfly is short volatility and short gap risk. It assumes that once the market opens, prices tend to mean-revert intraday. That assumption mostly held from 2020-2024. It broke in 2025. Tariff headlines, surprise rate-cut comments, and geopolitical flare-ups created a year where the intraday "knife-fight" regime became the norm rather than the exception. The strategy didn't get worse. The environment got worse for the strategy.
Position Sizing: The Math That Keeps You Alive
Most blow-ups in this strategy aren't from a single bad trade. They're from oversizing a single bad trade. The math of selling premium is unforgiving: small wins, occasional large losses. If your position size is wrong, one bad day takes out a month — or a year.
Here's the framework I use:
| Account Size | Contracts per Trade | Max Risk per Trade | % of Account |
|---|---|---|---|
| $6,000 | 1 contract | ~$1,000 | 17% |
| $25,000 | 2-3 contracts | ~$2,500 | 10% |
| $50,000 | 4-5 contracts | ~$5,000 | 10% |
| $100,000 | 8-10 contracts | ~$10,000 | 10% |
Note that I run the test account at 17% risk per trade, which is aggressive. I do it because the account is sized specifically for testing the strategy. You should not do that on a real, life-savings account. A 10% risk-per-trade cap is the higher end of what I'd consider reasonable for a strategy that can have 4-5 consecutive losers.
When I Trade It and When I Don't
After 254 trades, here are the conditions where the strategy works best and the conditions where I now stay flat.
Days I trade
- VIX between 12 and 22. Sweet spot. Enough premium to make the trade worthwhile, not so much that intraday moves blow through the wings.
- No major macro release before close. No FOMC, no CPI, no NFP. I learned this the hard way.
- SPX overnight range under 0.75%. Calmer overnight session usually means calmer day session.
- Friday afternoons in slow weeks. Low expected-move days are gold.
Days I skip
- VIX above 25 or under 12. High VIX = bigger moves. Low VIX = not enough premium to clear my 50%-of-max-profit threshold.
- FOMC days. 2pm press conference, anything can happen. I'm out.
- Tariff or geopolitical headline risk. 2025 trained me on this. If there's a possible Trump tweet or surprise policy announcement, I sit out.
- Quad witching. Final hour can do weird things.
- The day after a 1%+ move. Volatility tends to cluster.
Who Should Trade This Strategy?
Brutally honest: not most people.
This strategy is for you if you have:
- $50,000+ in an account you can afford to lose 30% of without changing your life
- Approval for spread trading on SPX (most brokers require Level 3 options approval)
- Time to monitor trades between 9:45am and 4:00pm ET
- Two-plus years of options experience — you've sold puts, sold credit spreads, and rolled a few losers
- Iron discipline to honor stop losses when the trade goes against you
This strategy is NOT for you if:
- You're new to options (start with the wheel strategy instead)
- Your account is under $25,000 (the math doesn't work — slippage eats the edge)
- You work a 9-5 job and can't monitor positions during market hours
- The thought of losing $3,000 in one day would change how you sleep
- You can't follow rules when you're losing money
The Strategic Lesson: Diversification
The biggest takeaway from running 254 iron butterflies isn't a tactical insight about strikes or stops. It's a strategic one about portfolio construction. No single options strategy works in every market regime. The iron butterfly thrived in 2024 because intraday moves were tame. The wheel strategy thrived in 2024 and 2025 because both years had buyable dips and recoverable drawdowns. SPY put credit spreads thrive when the market grinds higher with low realized volatility.
In 2025, when iron butterflies were getting punished, I shifted capital toward the wheel strategy. That pivot — which course members watched happen in real time through the alerts — was only possible because I run multiple strategies simultaneously. If iron butterflies had been my only strategy, I'd have spent 2025 either bleeding capital or sitting in cash watching opportunities pass.
I cover the full multi-strategy framework in this companion post on options income strategies. Read it after this one.
Current Status: Why You're Seeing Fewer Iron Butterfly Trades
As of mid-2026, I've reduced my iron butterfly cadence significantly. Not because the strategy is "broken" — but because the current macro environment still resembles 2025 more than 2024. Tariff policy remains a wildcard. Fed policy is in transition. Intraday vol regimes shift week to week.
I still take the trade when the setup is right: low overnight range, VIX in the 14-20 band, no macro releases, no headline risk. But I've gone from "fire every trading day" to "trade selectively, maybe 6-8 times a month." The course alerts reflect this — and several students appreciated the honesty over the alternative of placing trades for the sake of placing trades.
I wrote a longer update on this shift here.
Bottom Line: A Strategy That Works Until It Doesn't
The zero DTE SPX iron butterfly is one of the highest-percentage-return premium-selling strategies available to retail traders. In a friendly market, it can produce returns that look unbelievable. In a hostile market, it can erase a year of gains in three weeks. Both things are true. Anyone telling you only the first half is selling you something.
The strategy is a tool. Like any tool, it has the conditions where it shines and the conditions where it's the wrong fit. The skill isn't running it — the mechanics are simple. The skill is knowing when to deploy it, when to stand down, and when to redeploy your capital to a different strategy that fits the current regime.
That last skill — adaptation — is what separates traders who survive multiple regimes from traders who blow up in their first bad year. It's also what I teach in the Options Cafe course: not just one strategy, but a portfolio of three, plus the framework to decide which one fits the current market. $150 lifetime access, every trade I make broadcast in real time, every loser explained.
Ready to learn options trading?
Start learning how to successfully trade options to earn monthly income.
Related Topics: Zero Dte Iron Butterfly, 0 Dte Spx Options Strategy, Zero Dte Options Strategy, Spx Iron Butterfly, Iron Butterfly Strategy, 0dte Trading, Spx Options Trading, Advanced Options Strategy, Options Income Strategy, Premium Selling Strategies