AFRM (Affirm) Stock Analysis: Hold at $49 | $65 Target
Table of Contents
Executive Summary
This AFRM stock analysis covers Affirm Holdings' fundamentals, technicals, SEC filings, market sentiment, and insider activity as of April 9, 2026. The full Affirm stock analysis below is built on 8 research notes, the FY2025 10-K, the Q2 FY2026 10-Q, 85+ parsed insider transactions across five years, and a Reddit/Twitter sentiment sweep. Bottom line:
- HOLD at $48.72 with a $65 12-18 month target (+33% upside). Affirm has achieved something genuinely remarkable — turning a company that burned $2.92B in cumulative losses into one that printed $130M in net income in a single quarter. The profitability inflection is real, the growth is still 30%+, and the Amazon partnership now runs through 2031. But at 40x run-rate P/E with zero insider purchases across 85 transactions, I can't call this a buy — not yet.
- The profitability inflection is proven. H1 FY2026 delivered $210M of net income on $2.06B of revenue. Q2 was the first-ever $1B revenue quarter ($1.1B, +30% YoY) with a 12.6% net margin. FY2026 is on pace for ~$1.20+ diluted EPS. This is no longer a speculative "will they ever make money" story.
- Growth remains exceptional at scale. GMV +36%, active consumers +23%, transactions per consumer +20%. For a company with $3.2B+ in annual revenue, this is best-in-class buy now, pay later performance.
- Zero insider purchases — ever. 85+ transactions across 5 years. 100% sales. $166.6M from CEO Max Levchin alone. Not during the 2022 crash to $8.62. Not during the current 40% drawdown. Not once. This is the single most damning data point in the entire file.
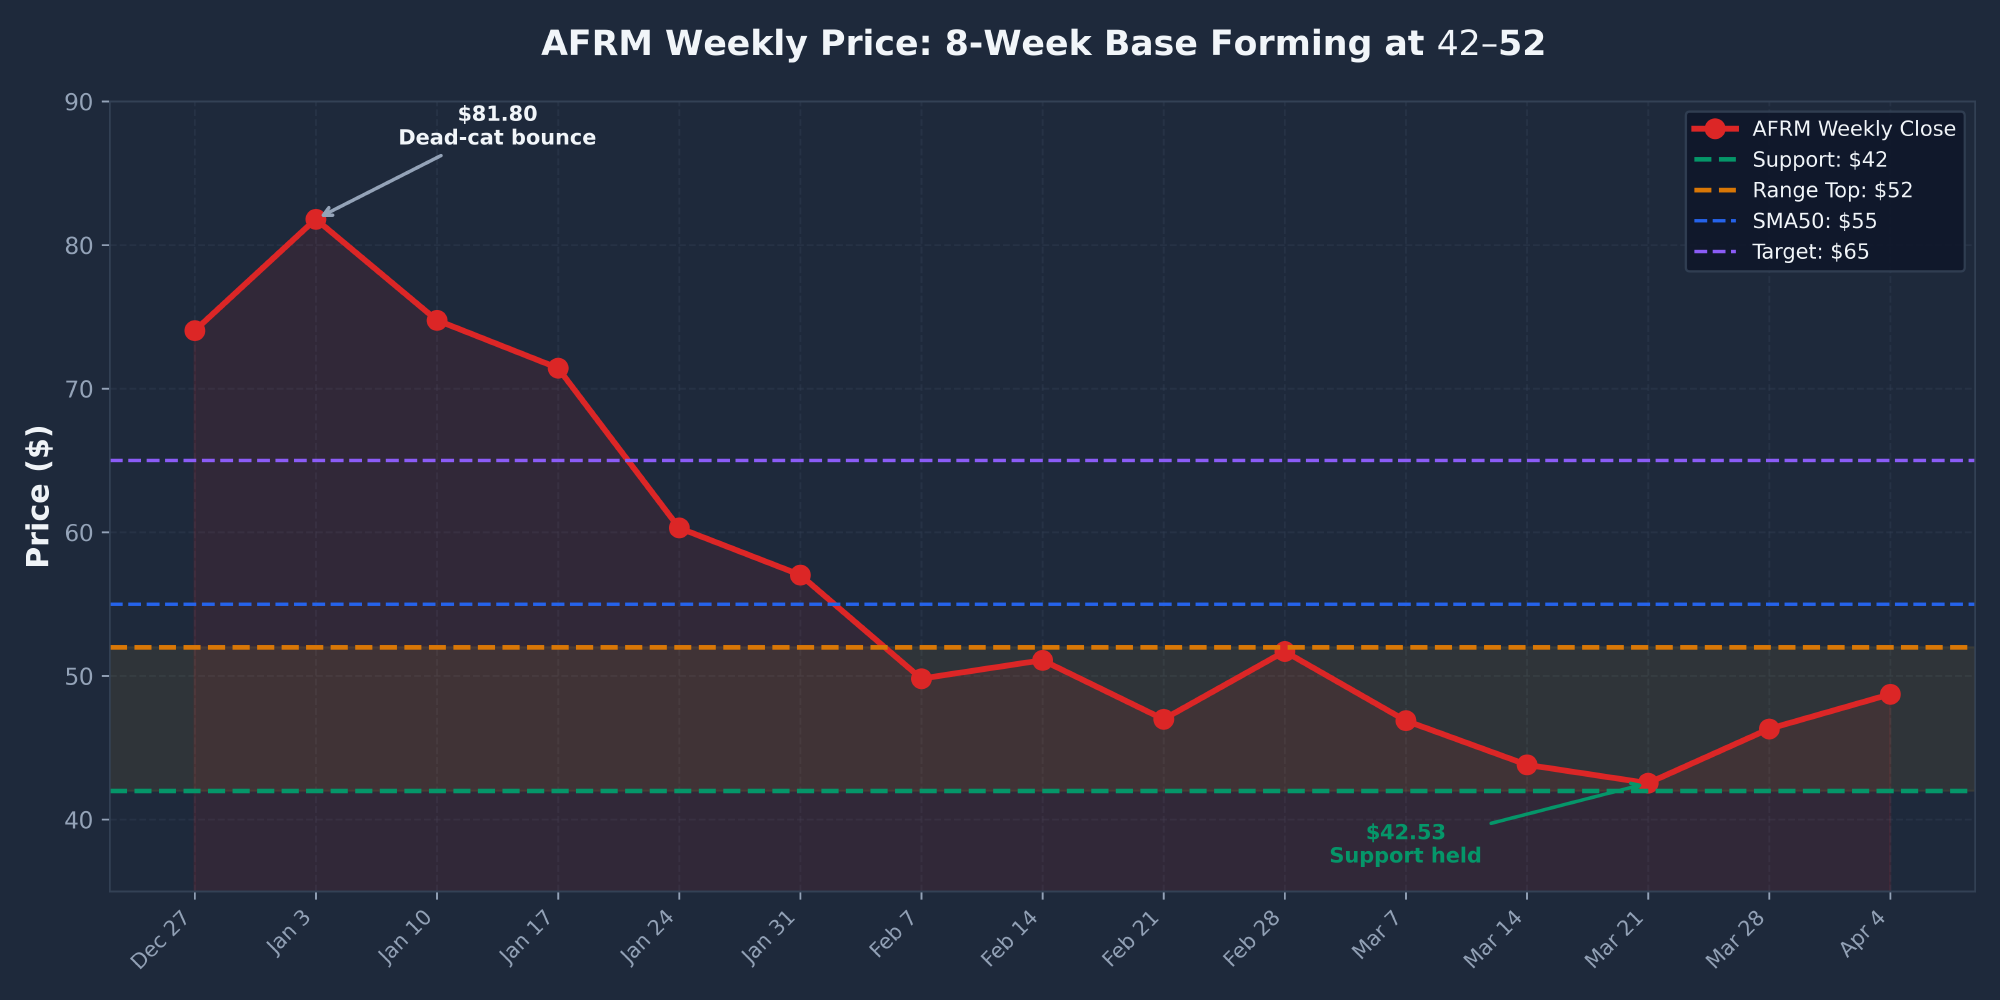
- The 8-week base is the only thing that's changed. The stock has consolidated between $42 and $52 for 8 weeks, the MACD histogram has flipped positive for the first time since October 2025, and $42.53 has been tested and held as support. The technicals are cautiously improving but haven't confirmed a trend reversal.
- Stone Ridge / LENDX scare tested the thesis. A March 18 WSJ story about private credit redemption stress at the Stone Ridge LENDX fund (which holds Affirm-originated loans) triggered a selloff. Management pre-empted the narrative at the Investor Forum on March 17, but the overhang hasn't fully cleared.
| Report | Signal | Key Finding |
|---|---|---|
| Fundamentals | BULLISH | $3.4B TTM revenue +30%, first GAAP profit year, $1.1B Q2, forward P/E 29.7x, PEG 0.20 |
| Technical | IMPROVING | 8-week base $42-52, MACD crossover forming, RSI bullish divergence. Below SMA50/200. |
| SEC Filings | BULLISH | Q2 FY2026 10-Q: $1.1B revenue, $130M net income. Amazon 2031 extension confirmed. Stable credit. |
| News | MIXED | Stone Ridge LENDX scare (bearish) vs. Amazon 2031 extension + Costco + Stripe AI partnership (bullish). |
| Sentiment | BEARISH | Reddit dead silent (retail capitulated). Twitter bearish on LENDX. Analyst consensus still Buy ($82 target). |
| Insider Trading | BEARISH | Zero buys, 85+ sells, $166M CEO selling. CFO "sell to zero" pattern. Institutions net +3.44%. |
| COMPOSITE | HOLD | 2 bullish + 1 improving + 1 mixed + 2 bearish. Fundamentals strong but insider + sentiment red flags say wait. |
Investment Thesis
Affirm Holdings, Inc. (NASDAQ: AFRM) is a $16.3B buy-now-pay-later fintech company founded by PayPal co-founder Max Levchin. Affirm enables consumers to split purchases into installment payments at the point of sale, partnering with merchants including Amazon (24% of GMV), Shopify, Walmart, and now Costco. The company differentiates from competitors like Klarna and Afterpay by not charging late fees and by clearly disclosing total interest costs upfront.
The Affirm story is a classic GARP (growth at a reasonable price) setup with a few large, well-defined pros and cons. Revenue has tripled from $1.35B (FY2022) to $3.43B (TTM), and the company has undergone a dramatic profitability transition — from losing nearly $1B per year (FY2023) to printing $130M in net income in a single quarter (Q2 FY2026). At 29.7x forward P/E with 30%+ growth, the PEG ratio of 0.20 is statistically cheap.
So why HOLD instead of BUY? Three things keep me on the sideline:
- Zero insider purchases across 85+ transactions. CEO Levchin has sold $166.6M and has never bought a share on the open market. The CFO sells every vested share to zero. Not during the $8.62 crash. Not during this 40% drawdown. Nobody at Affirm has ever voluntarily put personal capital into the stock. That's the strongest bearish signal in the entire file.
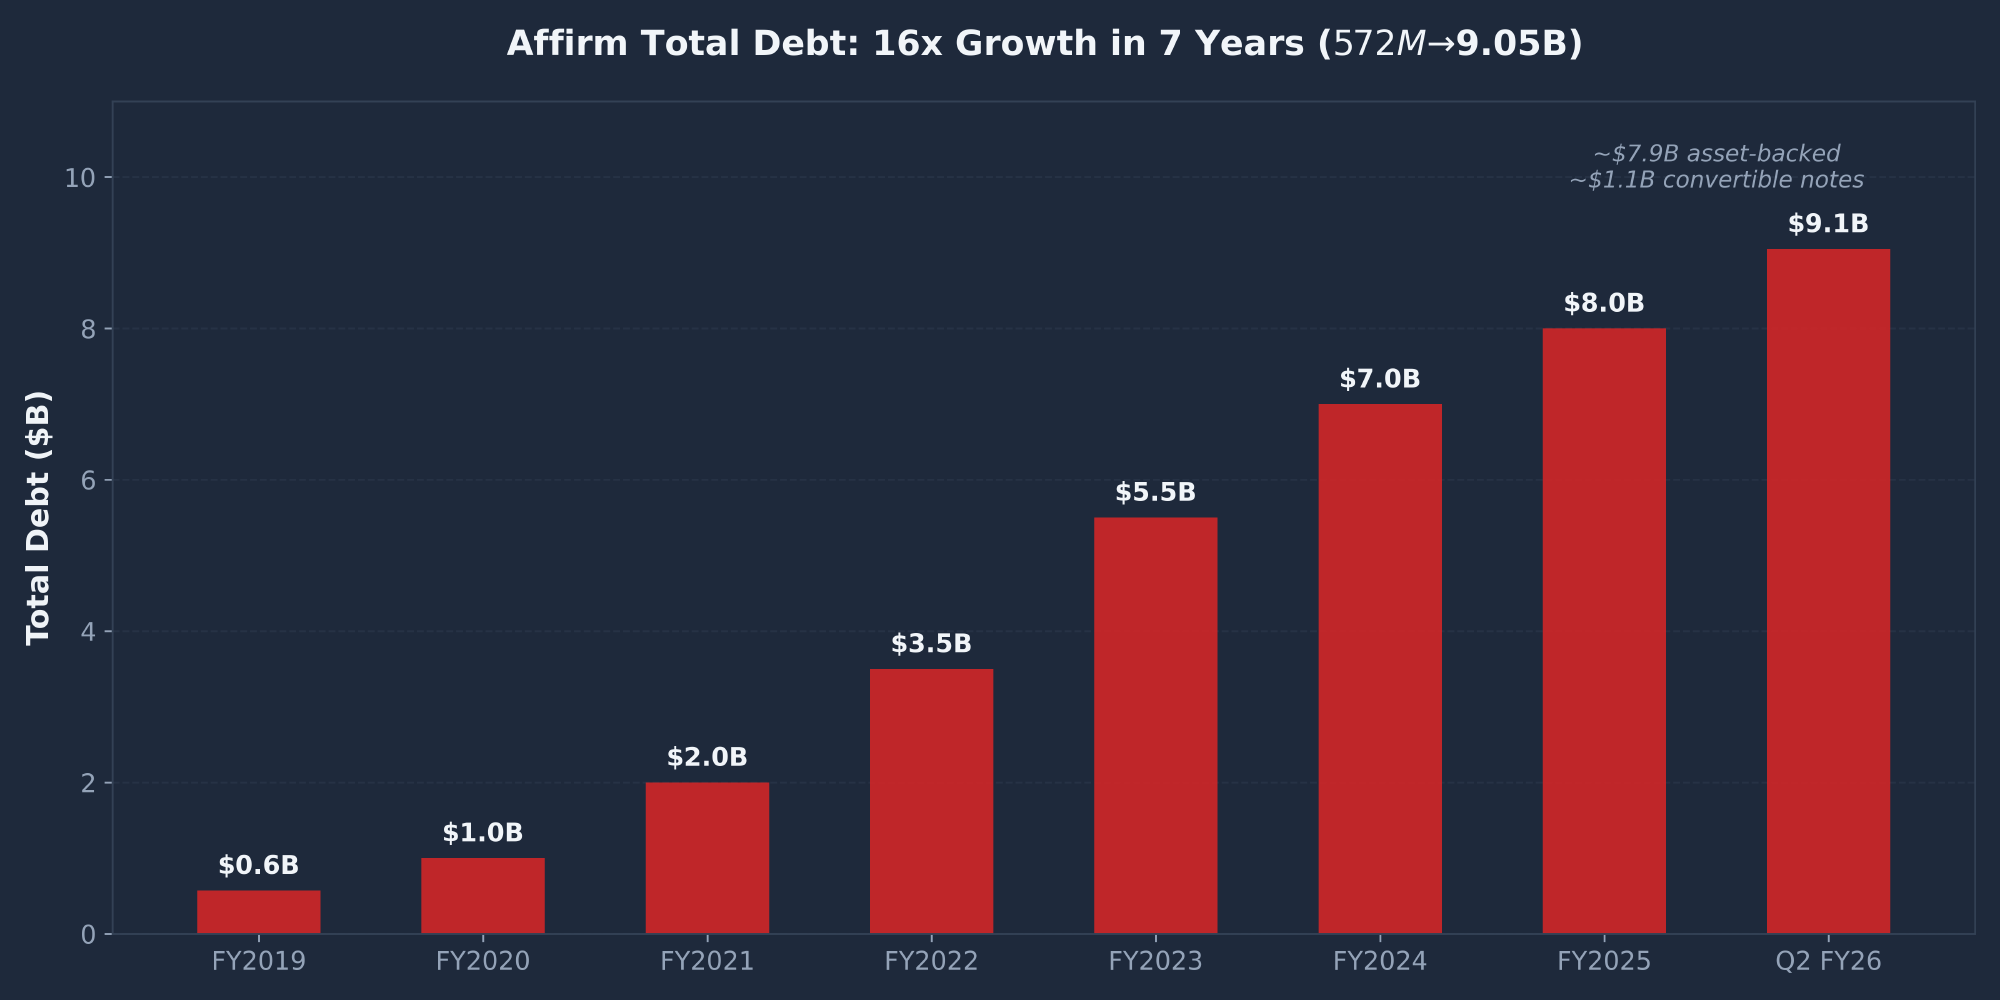
- 40x run-rate P/E for a lender. Affirm is priced as a hyper-growth fintech, but it's fundamentally a lending business with an $8B loan book and $9B in debt. If growth decelerates to 15-20%, the multiple compresses hard — 25-30% downside.
- Credit cycle risk is untested. Affirm has never operated through a consumer credit recession. The entire BNPL category is untested in a downturn. The $9.05B debt stack (16x growth in 7 years) adds leverage to any consumer credit stress.
The action plan: hold if you own it, don't add until either (a) the stock breaks above $55 (SMA50) to confirm the base, or (b) Q3 FY2026 earnings in May show continued margin expansion. New buyers should wait for a better entry — either at $42 support or on a confirmed breakout above $55.
Fundamental Analysis
Revenue & Profitability Transition
| Year | Revenue | Op Income | Net Income | Op Margin |
|---|---|---|---|---|
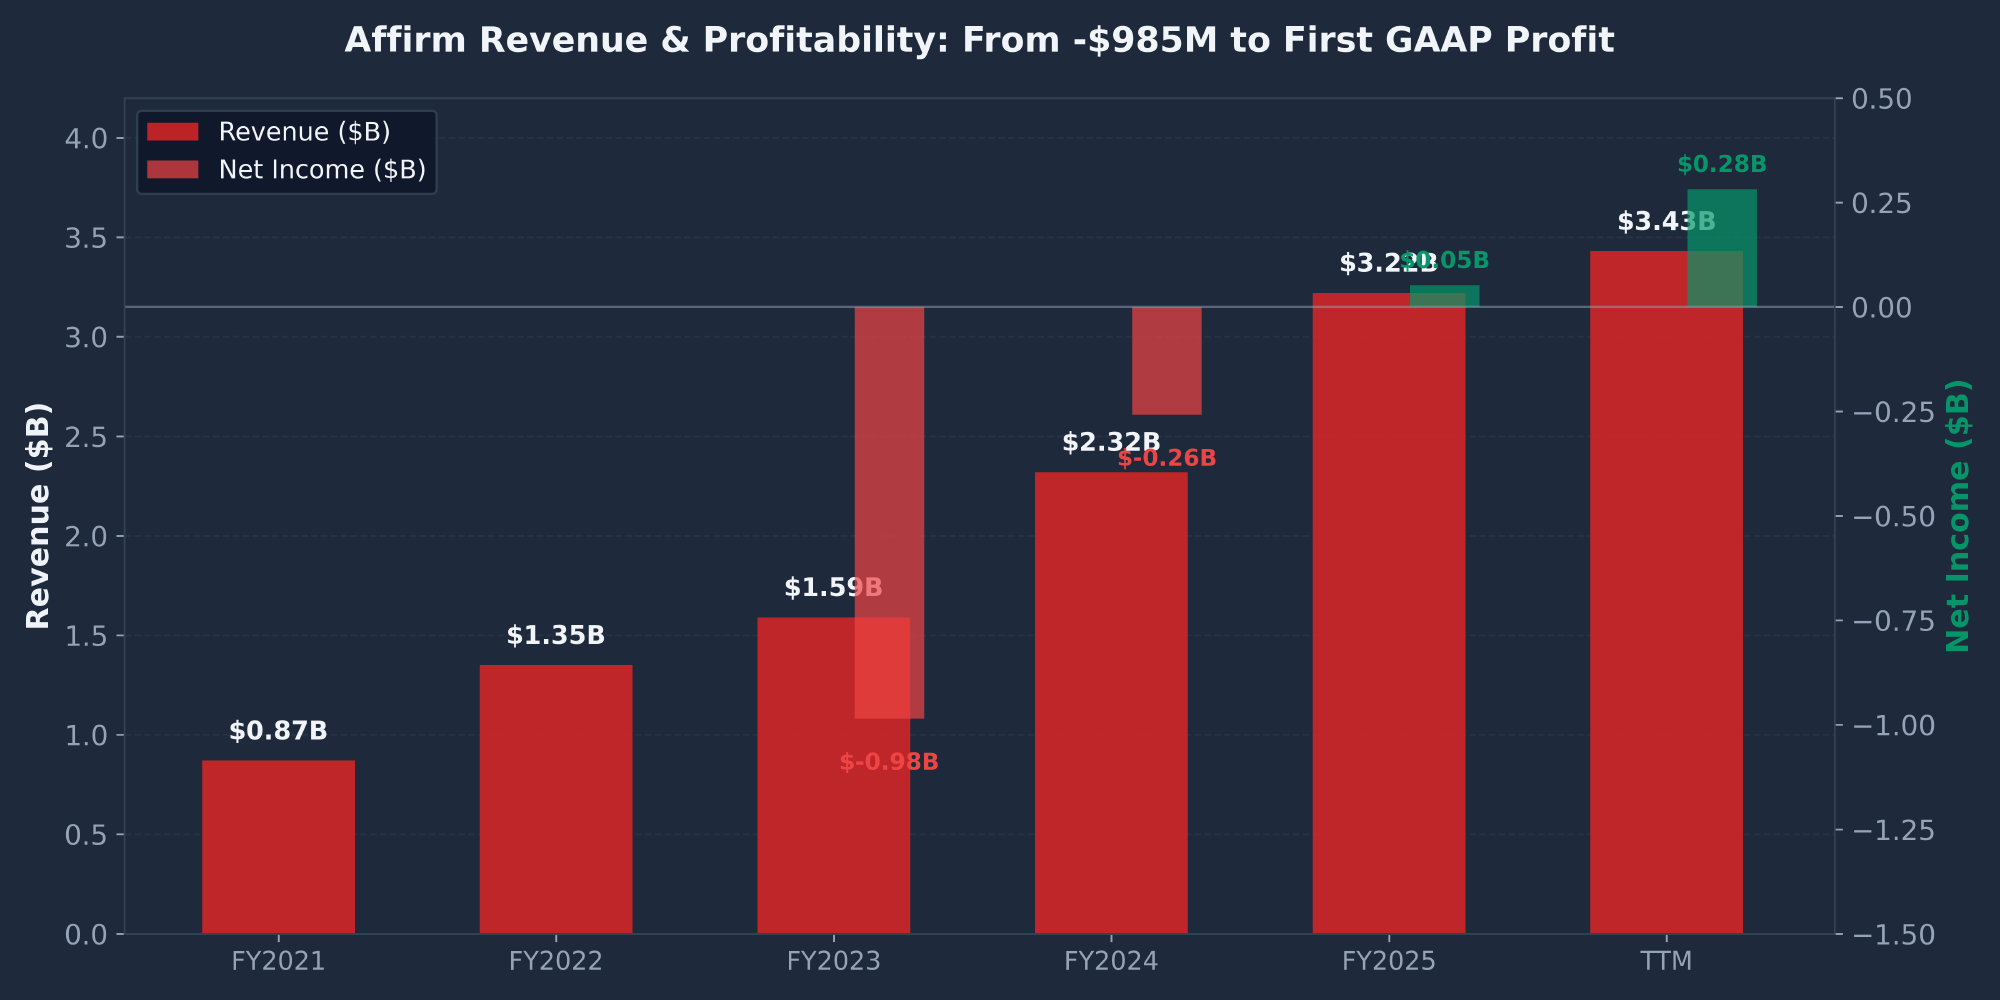
| FY2023 | $1.59B | ($1.2B) | ($985M) | -75% |
| FY2024 | $2.32B | ($258M) | (negative) | -11% |
| FY2025 | $3.22B (+39%) | $342M | $52M | +10.6% |
| TTM (Q2 FY26) | $3.43B | $664M | $282M | +19.4% |
The profitability transition is the most important chart in the AFRM file. Operating margin went from -75% (FY2023) to +19.4% (TTM) — a nearly 100-point swing in three years. Q2 FY2026 was the breakout quarter: $1,123M revenue (+30%), $130M net income, $0.37 diluted EPS, 22.3% operating margin. H1 FY2026 totals: $2.06B revenue, $210M net income, $0.60 EPS.
Growth Metrics — Still Exceptional
| Metric (Q2 FY2026) | Value | YoY Growth |
|---|---|---|
| Gross Merchandise Volume | $13.8B | +36% |
| Active Consumers | 25.8M | +23% |
| Transactions per Active Consumer | 6.4 | +20% |
| Revenue | $1,123M | +30% |
The transactions-per-consumer metric (+20%) is the most important proof point for the Affirm Card thesis — consumers are using Affirm more frequently, which is what turns BNPL from a one-off checkout option into a habitual payment method.
Valuation
| Metric | Value | Read |
|---|---|---|
| Market Cap | $16.27B | Mid-cap |
| Enterprise Value | $22.72B | Debt-loaded |
| P/E (TTM) | 60.07 | High — reflects early profitability |
| Forward P/E | 29.71 | Reasonable if growth holds |
| PEG | 0.20 | Very low for growth profile |
| Beta | 3.69 | VERY HIGH — extreme risk-on/off sensitivity |
| Analyst Consensus | 1.56 (BUY) | Mean target $81.96 (+68%) |
Debt Structure — The Under-discussed Risk
Technical Analysis
AFRM closed at $48.72 on April 9, 2026 — down 40% from the $81.80 dead-cat bounce peak in January and 45% from the November 2025 high near $89. The stock has been range-bound between $42 and $52 for 8 consecutive weeks, forming the longest consolidation base since the November 2025 top.
8-Week Base Formation
Moving Average Analysis
| Indicator | Value | Price vs. MA | Signal |
|---|---|---|---|
| SMA 10-Day | $45.46 | +7.2% | BULLISH |
| SMA 50-Day | $55.13 | −11.6% | BEARISH |
| SMA 200-Day | $68.78 | −29.1% | BEARISH |
| RSI (14) | 35.61 | — | NEAR OVERSOLD |
| MACD Histogram | +0.20 | — | CROSSOVER FORMING |
The MACD histogram at +0.20 is the most important technical signal. It's the first positive reading since October 2025 — meaning the MACD line is rising faster than the signal line for the first time in 5 months. If this persists 1-2 more weeks, a confirmed bullish crossover will print. Combined with the RSI bullish divergence (RSI didn't make a new low when price did on March 21), the base looks constructive.
Key Levels
| Level | Price | Significance |
|---|---|---|
| Resistance 3 (SMA 200) | $68.78 | Long-term trend reclaim |
| Resistance 2 (Target) | $65 | 12-month price target |
| Resistance 1 (SMA 50) | $55.13 | BREAKOUT TRIGGER — confirms base |
| Range Top | $52 | Top of 8-week consolidation |
| Current Price | $48.72 | Mid-range |
| Support (Tested) | $42 | March 21 low ($42.53) — tested and held |
| Major Support | $30-35 | IPO cushion / prior base — if $42 breaks |
SEC Filings Deep Dive
No new periodic SEC filings since the February 5, 2026 Q2 FY2026 10-Q. EDGAR has been quiet with only routine RSU vesting events. The next major filing is the Q3 FY2026 10-Q expected in May after earnings.
Q2 FY2026 10-Q Highlights (Dec 2025 Quarter)
- Revenue: $1,123M (+30% YoY) — first-ever billion-dollar quarter
- Net income: $130M — largest quarterly profit in history
- Diluted EPS: $0.37
- GMV: $13.8B (+36% YoY)
- Active consumers: 25.8M (+23%)
- Amazon partnership: Extended through 2031 (confirmed December 8-K)
- Credit quality: Delinquency and charge-off rates stable vs. prior quarter
- Funding costs: Slightly declining due to improved securitization pricing
- Share count: ~333M diluted (minimal dilution)
Key Risk Factors From 10-K
| Risk | Severity | Status |
|---|---|---|
| Credit Cycle Exposure | HIGH | $8B loan book sensitive to consumer delinquency. Untested in a recession. |
| Merchant Concentration | HIGH | Amazon = 24% of GMV. De-risked by 2031 extension but still concentrated. |
| Funding Market Access | MEDIUM | Depends on private credit markets (Stone Ridge LENDX scare demonstrated this). |
| Regulatory (CFPB) | MEDIUM | BNPL regulatory uncertainty. CFPB could impose new rules on the category. |
| Competition (Klarna) | MEDIUM | Klarna IPO'd late 2025, won Walmart. Competitive intensity rising. |
News & Catalysts
~280 articles analyzed from March 11 to April 9, 2026. The news tape is dominated by two colliding narratives: the Stone Ridge LENDX scare (bearish) and multiple material positive partnerships (bullish).
The Two Big Stories
Stone Ridge / LENDX Scare (Mar 18)
WSJ reported the $7B Stone Ridge LENDX interval fund (holding AFRM-originated consumer loans) was facing redemption stress. Triggered multi-day selloff and "Big Tech funding risk" narrative across financial media. Barron's, Investing.com, and simplywall.st amplified it.
Mitigant: Management pre-empted the narrative at the March 17 Investor Forum, stating private credit partners offered better economics than prior arrangements.
Partnership Triple Play
- Amazon extended through 2031 (confirmed March 11) — 5 additional years beyond prior expiry. De-risks the 24% GMV concentration.
- Stripe AI Shopping Token partnership (March 12) — native Affirm BNPL embedded in Stripe's agentic commerce flow.
- Costco partnership launch (March 11) — top-5 US retailer, new merchant vertical.
Analyst Ratings
| Firm | Rating | Target |
|---|---|---|
| Needham | Buy | $100 |
| Citi | Buy | $100 |
| Rothschild Redburn | Buy | $101 |
| Wells Fargo | Overweight | $89 |
| BofA | Buy | $82 |
| TD Cowen | Buy (cut target) | $80 (from $90) |
| Consensus | 1.56 (BUY) | $81.96 (+68%) |
Upcoming Catalysts
- Q3 FY2026 Earnings (May 2026): The next major catalyst. March quarter results will show if the profitability trajectory is holding. Revenue consensus ~$1.1B. Any capex/margin guidance will move the stock.
- Stone Ridge / LENDX resolution: Ongoing. If redemption pressure eases, the funding-risk overhang lifts.
- Affirm Card growth data: Transactions per consumer metric is the key engagement proof point. Watch for Q3 updates.
- CFPB regulatory clarity: Any rulemaking on BNPL category would be a major catalyst in either direction.
Market Sentiment
The most important observation about AFRM sentiment is what isn't there. Reddit is dead silent. The previously active AFRM bull communities have gone dark. This is a classic retail capitulation signal — the 2024 bulls who rode AFRM to $80+ have exited and moved on.
Reddit — The Silence Is the Signal
| Subreddit | Posts (Past Month) | Dominant Theme |
|---|---|---|
| r/wallstreetbets | 0 | Complete silence. Last notable post: Aug 2025 "39k YOLO" at $89. |
| r/stocks | 0 | Nothing. Most engaged post in past year was bearish on BNPL. |
| r/ValueInvesting | 1 | "Which BNPL stock?" — answers overwhelmingly bearish on the category. |
| r/TeamAFRM, r/InvestAFRM | Dead | Fan subs essentially inactive vs. 2024 engagement levels. |
The strongest bear quote on Reddit (r/ValueInvesting, +65 upvotes): "BNPL is a disaster waiting to happen. No BNPL company has experienced a credit recession. No one has any idea if the models work or not."
Key finding: The Q2 FY26 earnings on February 5 were a strong beat (30% revenue growth, record profitability) and got almost zero Reddit discussion. In prior quarters, a beat like that would have generated dozens of DD posts and thousands of comments. Retail has capitulated.
Twitter/X — Stone Ridge Dominates
Twitter chatter leans bearish, driven by the LENDX scare. Notable voices: bulls citing the Amazon 2031 extension and management's Investor Forum rebuttal; bears citing the private credit dependency and $9B debt stack. The April 8 rally (+9.9%) flipped some short-term sentiment, but the structural bearishness around BNPL funding risk persists.
Insider & Institutional Activity
CEO Levchin's Selling Pattern
| Date | Value | Price |
|---|---|---|
| Jan 5, 2026 | $53.7M | $80.62 |
| Sep 22, 2025 | $58.2M | $89.27 |
| Aug 28, 2025 | $40.0M | $80.17 |
| Aug 22, 2025 | $13.4M | $80.10 |
| Aug 18, 2025 | $1.2M | $80.05 |
| Total (5 trades) | $166.6M | All at $80+ |
All five Levchin transactions are 10b5-1 plan option exercises at a $49 strike, immediately sold at $80+. The trigger is calibrated to the $80 zone — which is why sales stopped when the stock dropped below $80 in January. At $48.72 today, no trigger is hitting.
CFO Rob O'Hare's "sell to zero" pattern: After every sale, his share count drops to exactly ~1,368 shares. He then accumulates via RSU vests and sells again. Most recent: January 5 — exercised 36,401 options at $27.80, sold at $80 for $2.91M.
Institutional vs. Insider Divergence
The most interesting finding: insiders are net selling while institutions are net accumulating (+3.44% over 6 months). These two groups are reading the tape differently. Institutions see the profitability inflection and growth metrics; insiders see something institutions don't — or are simply liquidating compensation at every opportunity.
Risk Factors
| Risk | Probability | Impact | Detail |
|---|---|---|---|
| Consumer Credit Cycle | Medium | Critical | $8B loan book untested in a recession. No BNPL company has operated through a credit downturn. |
| Growth Deceleration | Medium | High | At 40x run-rate P/E, any deceleration below 20% growth compresses the multiple to $35. |
| Funding Market Stress | Medium | Medium-High | $9.05B debt depends on private credit markets. Stone Ridge scare showed vulnerability. |
| Zero Insider Buying | Ongoing | Medium | 85+ sells, 0 buys, $166M CEO selling. Insiders have never bought at any price. |
| Amazon Concentration | Low (de-risked) | High | 24% of GMV, but extended through 2031. Residual tail risk if Amazon builds in-house BNPL. |
| Klarna Competition | Medium | Medium | Klarna IPO'd late 2025, won Walmart. Competitive intensity in merchant acquisition rising. |
| Beta / Volatility | Ongoing | Medium | Beta 3.69 means ~6% daily average true range. Position sizing must account for extreme volatility. |
Conclusion & Price Targets
Four-Scenario Price Target Model
| Scenario | Target | Return | Probability | Drivers |
|---|---|---|---|---|
| Bull | $80 | +64% | 25% | Q3 beat, breakout above $55, re-rating to 35x forward |
| Base | $65 | +33% | 50% | Consolidation, slow drift to target as margins prove out |
| Muddle | $50 | +3% | 15% | Chop continues, no catalyst to resolve the range |
| Bear | $30 | −38% | 10% | Credit cycle hits, growth decelerates, $42 breaks, funding stress |
Expected Value: $80 × 25% + $65 × 50% + $50 × 15% + $30 × 10% = $63.00 (+29% from $48.72).
Bull vs. Bear
Bull Case ($80)
- Profitability inflection proven — $1.20+ FY2026 EPS
- GMV +36%, consumers +23%, engagement +20%
- Amazon 2031 extension eliminates concentration risk
- Costco + Stripe partnerships expand TAM
- Forward P/E 29.7x with PEG 0.20 is cheap
Bear Case ($30)
- Zero insider buys ever — $166M CEO selling
- 40x run-rate P/E for a lender with $9B debt
- Credit cycle risk untested in any downturn
- $9.05B debt stack — 16x growth in 7 years
- Klarna + incumbents increasing competitive pressure
Action Plan
| Profile | Action |
|---|---|
| Existing Holders | Hold. Don't add until $55 breakout or Q3 earnings clarity in May. Stop at $38. |
| New Buyers | Wait. Enter on confirmed breakout above $55 (SMA50) or at $42 support retest. Small position — 1-2% max. |
| Options Traders | Beta 3.69 makes IV rich. Sell $40 puts 30-45 DTE — collect premium below the tested support level. The cash-secured puts strategy works well on oversold high-beta stocks. |
Final Verdict
Frequently Asked Questions
Is AFRM a good stock to buy in 2026?
Not at current levels — this Affirm stock analysis lands on HOLD, not BUY. The profitability inflection is real ($130M quarterly profit, 30% growth, PEG 0.20), but zero insider purchases across 85+ transactions and a 40x run-rate P/E for a lending business keep the risk/reward from being compelling. Wait for either a confirmed breakout above $55 (SMA50) or a retest of $42 support before entering. If you already own it, hold — the fundamentals support the $65 target over 12-18 months.
What is the AFRM price target for 2026?
My base case 12-18 month target is $65 (+33% upside), with a bull case of $80 (+64%) if Q3 earnings beat and the stock breaks out. Wall Street consensus is more aggressive at $81.96 (+68%) — every major bank (Needham, Citi, Rothschild Redburn, Wells Fargo, BofA) has Buy ratings with targets of $82-$101. The bear case is $30 (-38%) if credit quality deteriorates or growth decelerates below 20%.
Should I buy or sell AFRM stock right now?
Neither — hold if you own it, wait if you don't. The 8-week base between $42 and $52 hasn't resolved yet. A weekly close above $55 (SMA50) would be the buy trigger. A weekly close below $42 would be the sell trigger. Q3 FY2026 earnings in May is the next major catalyst. The worst thing to do is buy mid-range in a base that could break either way — let the stock tell you which direction it's going.
Why did AFRM drop 45% from its November 2025 high?
Three factors: (1) broader tech/fintech selloff from January-March 2026 driven by tariff fears and risk-off rotation, (2) the Stone Ridge LENDX scare on March 18 which highlighted Affirm's dependency on private credit markets for loan funding, and (3) valuation compression from $89 to $42 as the market rotated away from high-multiple growth stocks. The underlying business is performing well — Q2 FY2026 delivered record revenue, record profit, and 30%+ growth — but the macro environment turned hostile for high-beta fintechs.
For more on the strategies referenced in this report, see my guides to the wheel strategy and cash-secured puts — the high IV environment on AFRM (beta 3.69) makes premium selling particularly attractive. You can also browse the best stocks for the wheel strategy for other high-premium candidates.
Sources: SEC Filings (AFRM 10-K FY2025, 10-Q Q2 FY2026), Finviz, Polygon.io, Google News, Reddit (r/wallstreetbets, r/stocks, r/ValueInvesting), Twitter/X. Report compiled April 9, 2026.