AMZN (Amazon) Stock Analysis: Hold at $209 | $240 Target
Table of Contents
Executive Summary
This AMZN stock analysis covers Amazon's fundamentals, technicals, SEC filings, market sentiment, and insider activity as of March 31, 2026. The full Amazon stock analysis below is built on every line of the FY2025 10-K, 200 parsed insider transactions, a Reddit and Twitter sentiment sweep, and the latest news flow. Here is my bottom line on Amazon.com:
- HOLD with a $240 12-month target (+14.7% upside). Amazon is trading at 29.2x earnings — a fair price for a $717B revenue machine growing 12% with margins still expanding. Not cheap enough to be a conviction buy, not expensive enough to sell. The 19% pullback from the November 2025 ATH has restored a reasonable risk/reward.
- AWS is the entire bull case. AWS revenue hit $128.7B (+20% YoY) and growth is re-accelerating from 17% (FY2023) → 19% (FY2024) → 20% (FY2025). On standalone cloud multiples, AWS alone would be worth $1T+. Every other Amazon segment is a footnote next to this.
- The $128.3B capex bet defines everything. FY2025 capital expenditure jumped 65% to $128.3B — almost entirely AI infrastructure for AWS. That single line item compressed free cash flow from $38.2B to $11.2B (-71%). Either Amazon just made a generational investment, or it just broke FCF for years. Q1 2026 earnings (late April) will start to settle the question.
- Operating margins keep climbing. Operating margin moved from 6.4% (FY2023) → 10.7% (FY2024) → 11.2% (FY2025). Net income grew 31% to $77.7B. Diluted EPS jumped from $5.53 to $7.17. The profit machine is firing harder than ever.
- The technical picture is mixed. AMZN trades below all major moving averages (SMA10, SMA50, SMA200), but the MACD just printed a bullish crossover, RSI is back to neutral at 51, and the stock is base-building between $198–$215 after a 20% tariff-driven crash in January–February. A break above $215 would confirm a near-term trend change.
- Insider selling is irrelevant noise. All 200 insider transactions reviewed are routine 10b5-1 plan sales — including Bezos's $19.3B over five years (less than 1% of market cap). Net institutional flow is +0.82% (mildly bullish) and short interest is 0.87% (no bear conviction).
| Report | Signal | Key Finding |
|---|---|---|
| Fundamentals | BULLISH | $717B revenue +12%, op margin 11.2%, net income +31%, AWS +20%, $123B liquidity |
| Technical | NEUTRAL | Below all MAs but MACD bullish crossover, base forming $198–$215, RSI 51 neutral |
| SEC Filings | BULLISH | 10-K shows fortress balance sheet, expanding margins. $128.3B capex is the only red flag. |
| News | BULLISH | "Cheapest Mag 7" narrative, Iran ceasefire rally (+3.8%), "priced for crisis" framing |
| Sentiment | MIXED | Reddit cautiously bearish (frustration). Twitter bullish ("cheapest in a decade"). 55/45 long-term bull. |
| Insider Trading | NEUTRAL | 200 of 200 sales are routine 10b5-1 plans. Net institutional flow +0.82% (buying). |
| COMPOSITE | HOLD | 3 bullish + 2 neutral + 1 mixed. Quality + valuation balance. Q1 earnings is the next catalyst. |
Investment Thesis
Amazon.com, Inc. (NASDAQ: AMZN) is a $2.23 trillion business that has quietly become one of the most profitable companies on the planet. The headline numbers from FY2025 are extraordinary: $716.9 billion in revenue (+12.4% YoY), $80 billion in operating income, $77.7 billion in net income, and an operating margin of 11.2% — nearly double what it was just two years ago. CEO Andy Jassy has executed a profitability transformation that turned Amazon from a "growth at any cost" story into one of the highest-earning companies in history.
The company operates three reporting segments: North America ($426.3B, +10% YoY), International ($161.9B, +13% YoY), and AWS ($128.7B, +20% YoY). AWS contributes only 18% of revenue but a disproportionate share of operating income (estimated $40B+) and is the primary engine of the bull case. AWS growth is re-accelerating — 17% in FY2023, 19% in FY2024, 20% in FY2025 — driven by AI workload adoption from enterprise customers.
So why a HOLD instead of a BUY? Because the stock is fairly priced for what it is. At 29.2x trailing earnings, AMZN trades at a slight discount to MSFT (~31x) and a premium to GOOG (~22x) and META (~24x). The premium over GOOG and META is justified by AMZN's faster earnings growth (+31% vs. peers) and AWS's AI tailwind, but the absolute multiple is not cheap. Add in the FCF compression from the capex surge and you get a stock that needs everything to go right to deliver the bull case ($280) over the next 12-18 months. The risk/reward is roughly symmetric — about 15% upside to base case, 16% downside to bear case.
The actionable strategy: existing holders should hold. New buyers should scale in over three tranches — 1/3 at $209, 1/3 if the stock pulls back to test $198 support, and 1/3 reserved for post-Q1 earnings clarity. The Q1 2026 earnings call in late April is the next major information event, and management's commentary on AWS growth and FY2026 capex guidance will determine whether this stock breaks out toward $240 or back-tests $185.
Fundamental Analysis
Revenue & Operating Margin
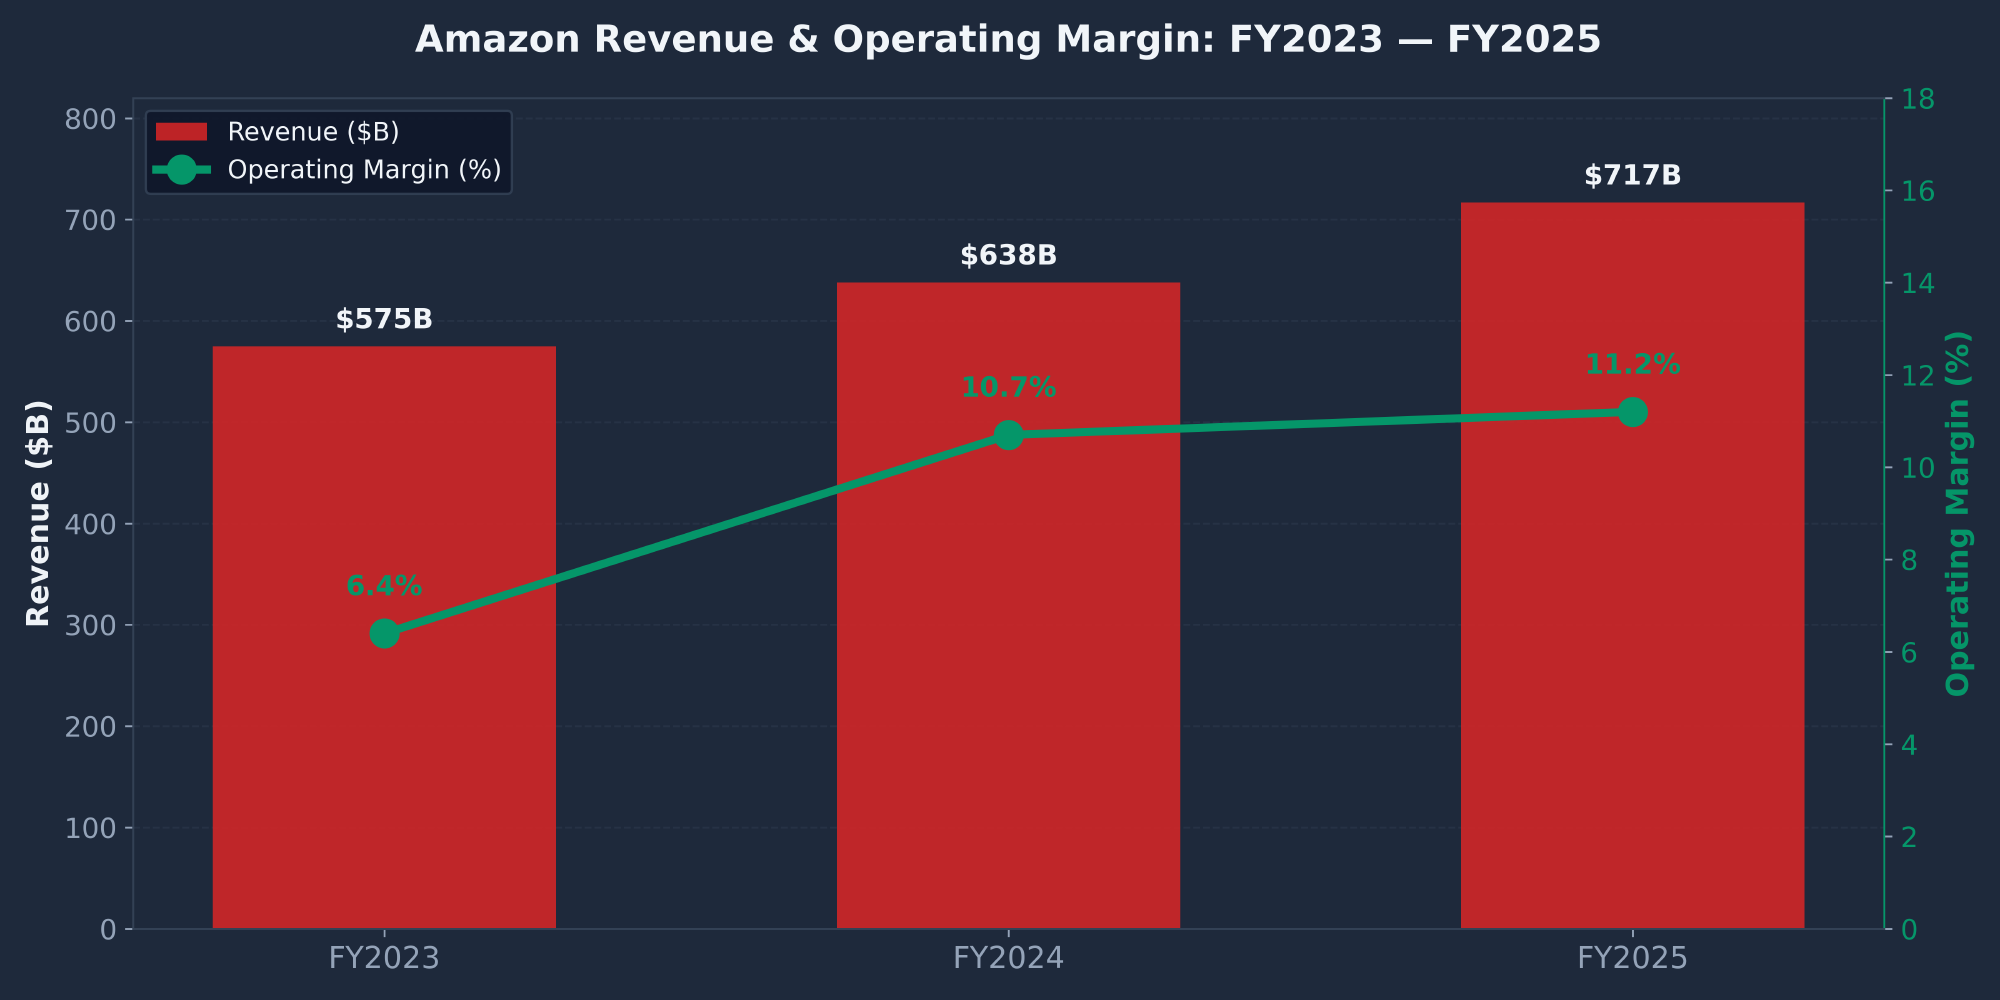
| Metric | FY2025 | FY2024 | FY2023 | YoY Growth |
|---|---|---|---|---|
| Revenue ($B) | 716.9 | 638.0 | 574.8 | +12.4% |
| Operating Income ($B) | 80.0 | 68.6 | 36.9 | +16.6% |
| Operating Margin | 11.2% | 10.7% | 6.4% | +50 bps |
| Net Income ($B) | 77.7 | 59.2 | 30.4 | +31.1% |
| Diluted EPS | $7.17 | $5.53 | $2.90 | +29.7% |
Amazon has delivered one of the most remarkable profitability inflections in mega-cap history. Revenue has compounded at ~12% annually while operating margin has nearly doubled, creating extraordinary operating leverage. Net income grew 155% from $30.4B to $77.7B in two years. This is not a "growth at any cost" company anymore — it's a quality earnings story that happens to have a $717B top line growing at double-digit rates.
Revenue by Segment (FY2025)
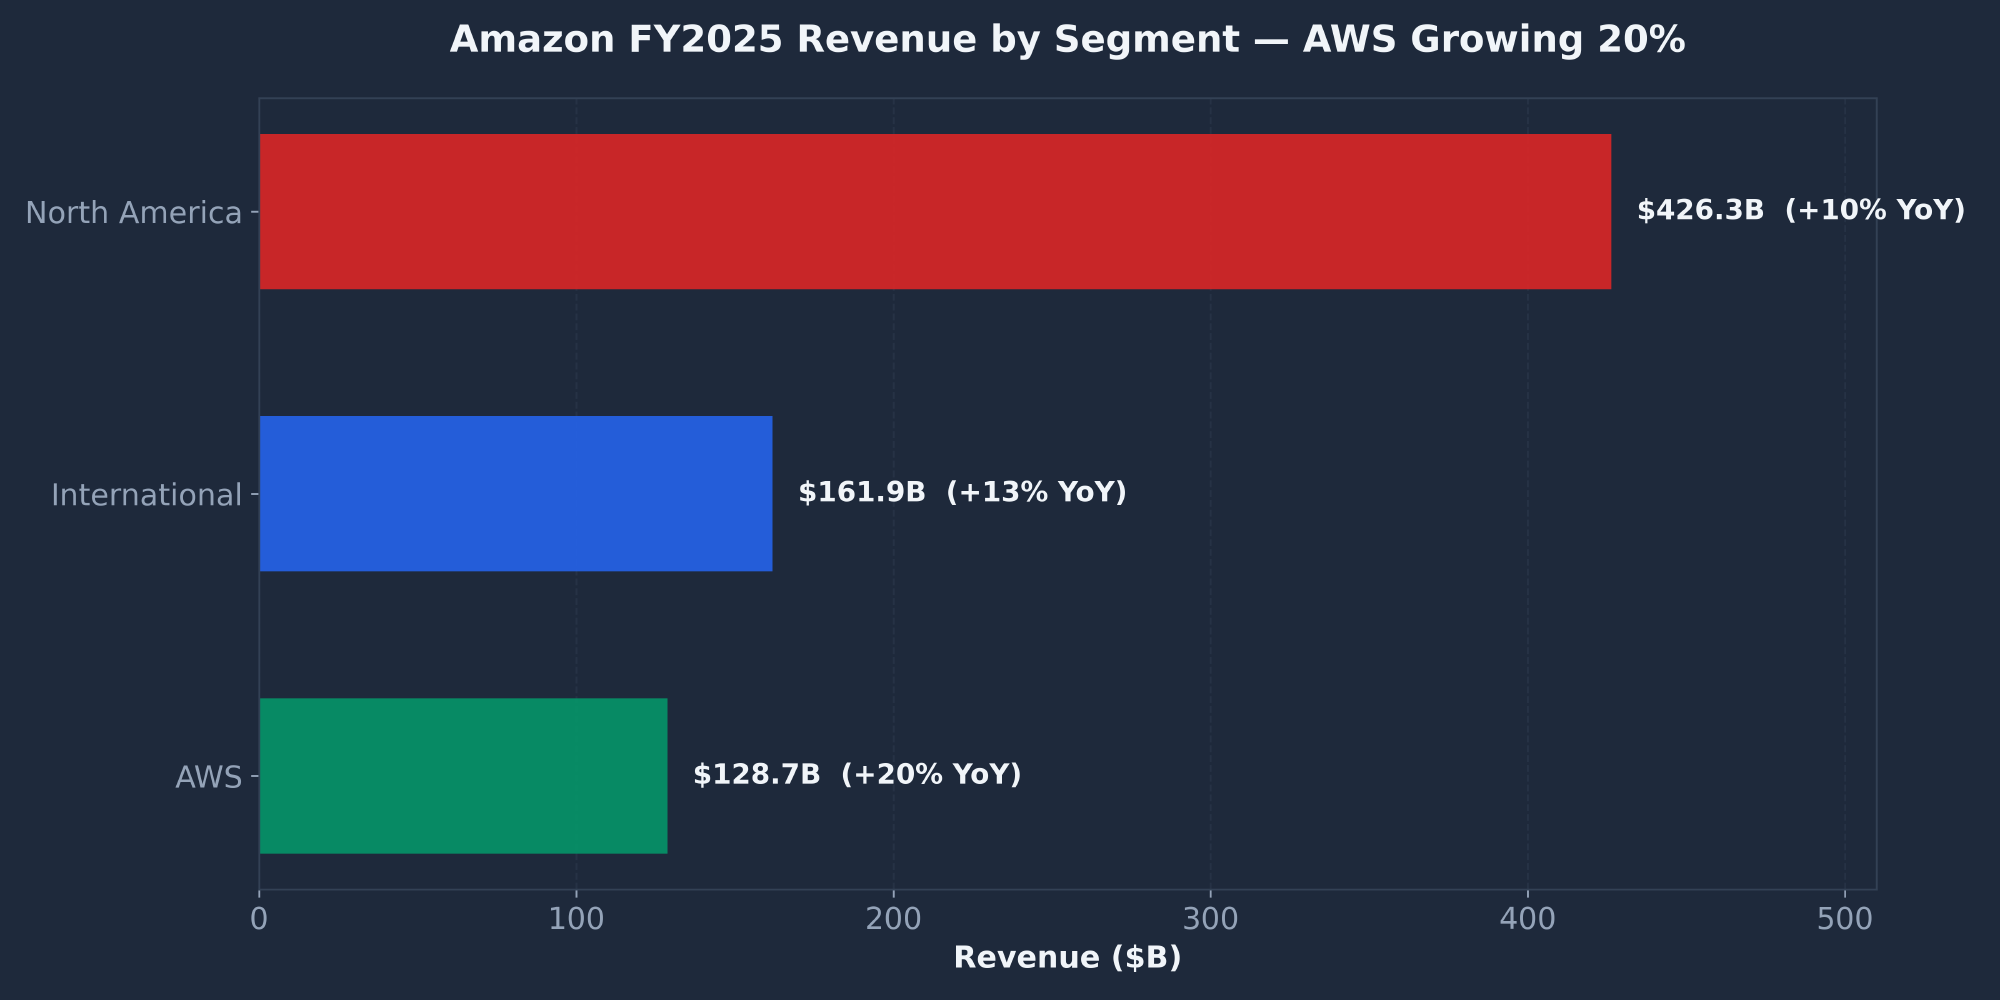
| Segment | FY2025 Revenue | % of Total | YoY Growth |
|---|---|---|---|
| North America | $426.3B | 59.5% | +10% |
| International | $161.9B | 22.6% | +13% |
| AWS | $128.7B | 18.0% | +20% |
| Total | $716.9B | 100% | +12.4% |
EPS Trajectory
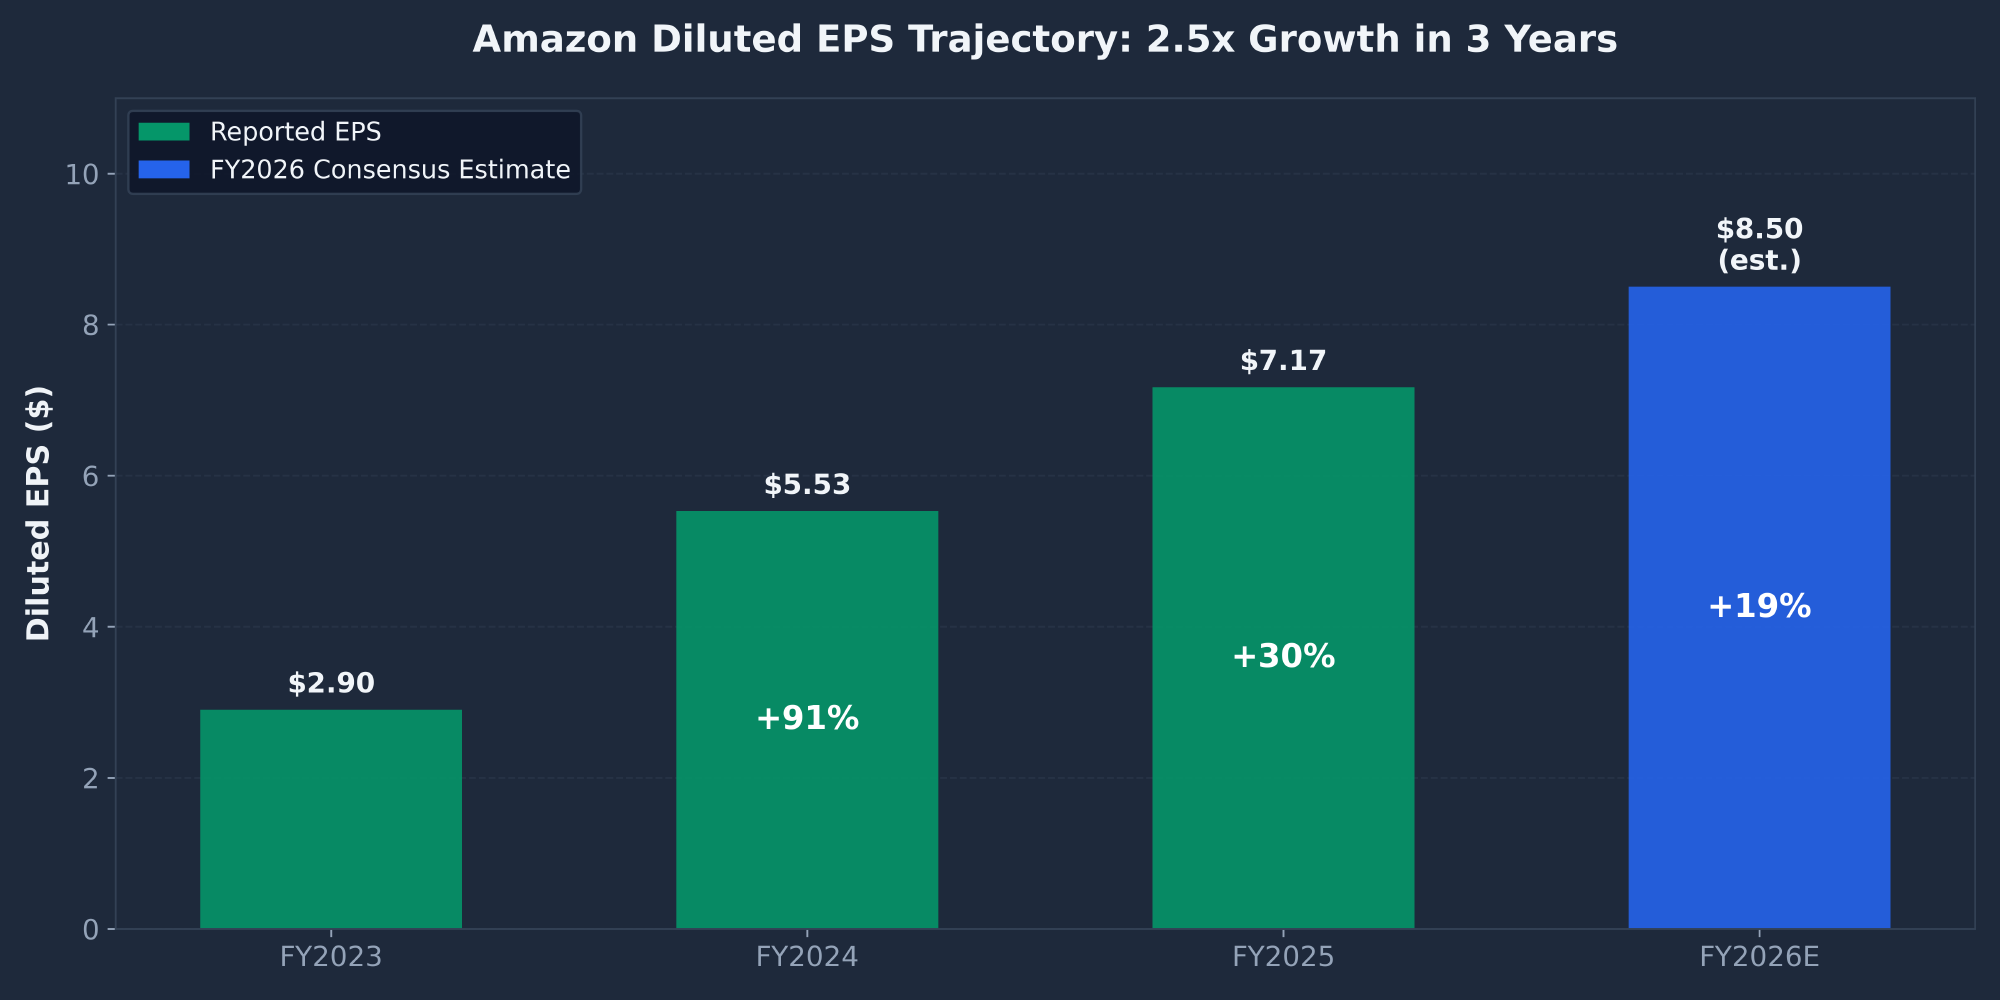
Diluted EPS has grown from $2.90 (FY2023) to $5.53 (FY2024) to $7.17 (FY2025) — a 2.5x increase in just two years. Consensus estimates for FY2026 sit around $8.50, implying another ~19% growth on top of the $7.17 base. The market is currently paying 29.2x trailing earnings or roughly 24.6x forward earnings, which is reasonable for a business compounding earnings at this rate.
Cash Flow: The $128B Question
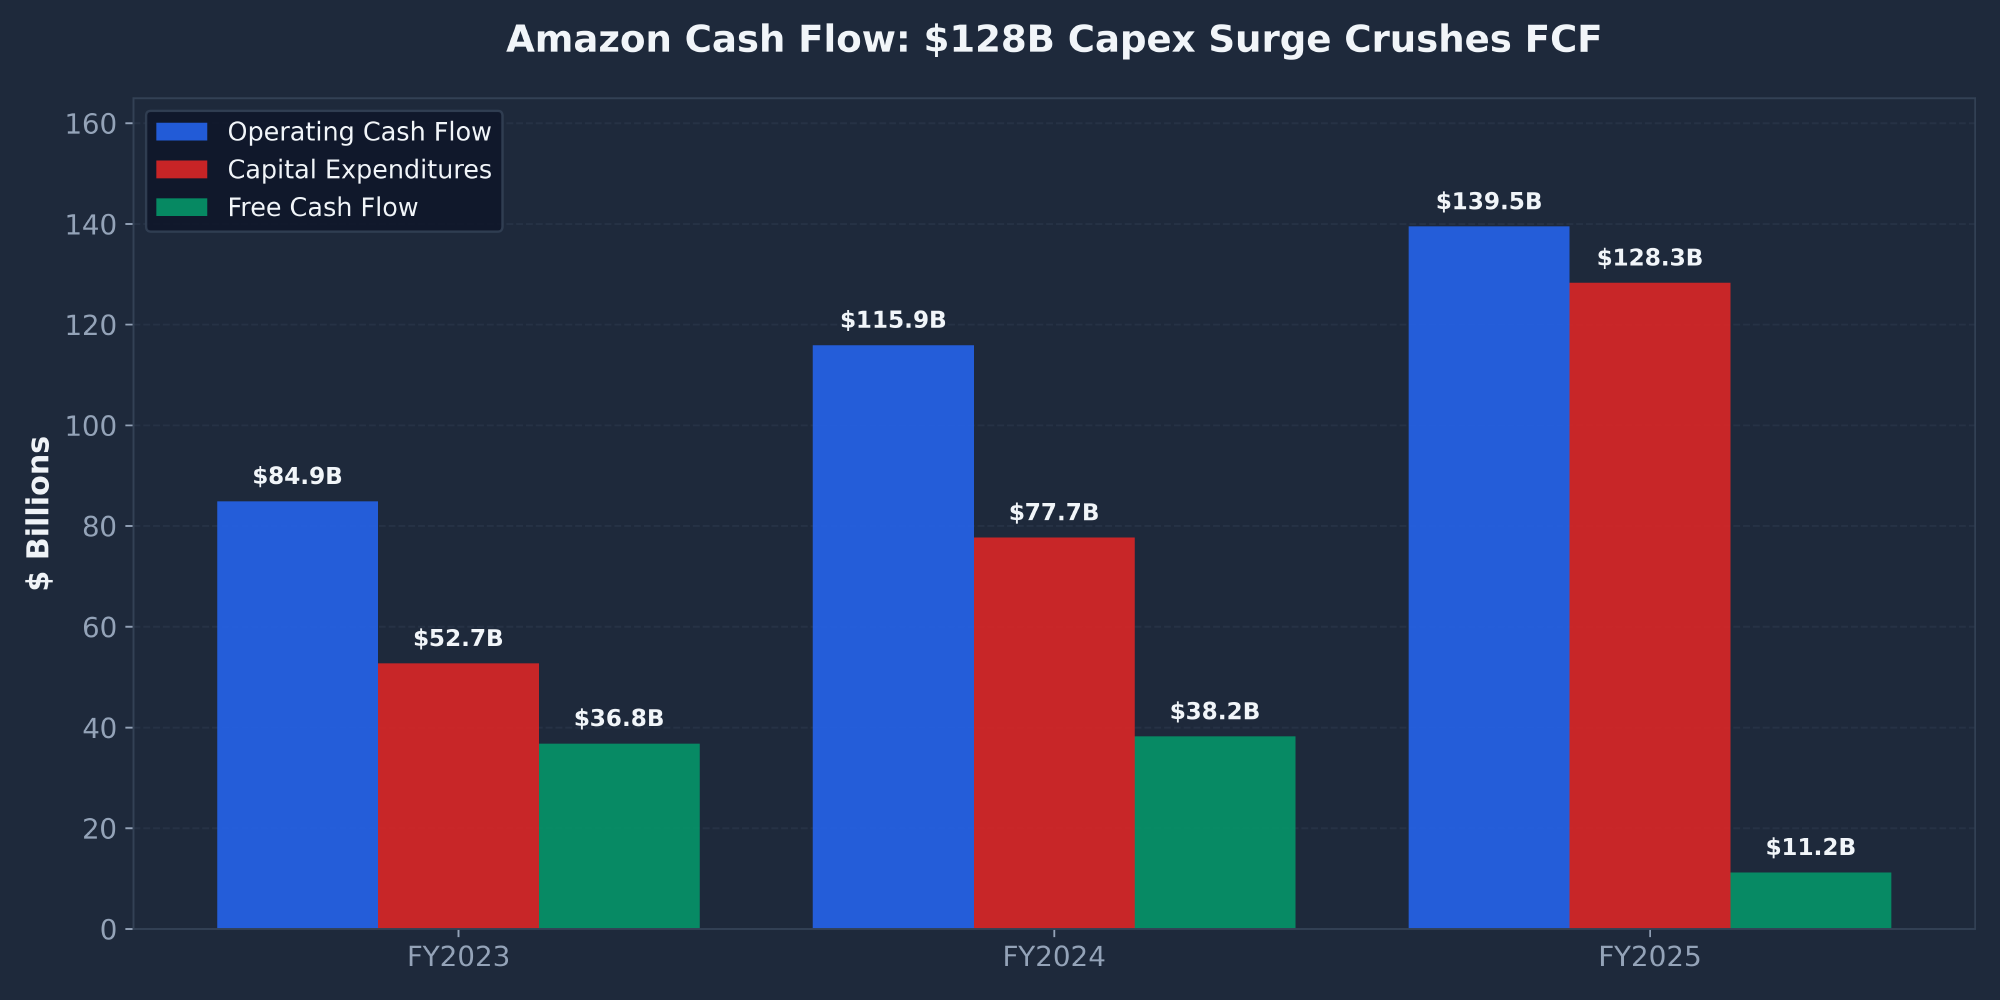
| Cash Flow Item | FY2025 | FY2024 | Change |
|---|---|---|---|
| Operating Cash Flow | $139.5B | $115.9B | +20.4% |
| Capital Expenditures | ($128.3B) | ($77.7B) | +65.1% |
| Free Cash Flow | $11.2B | $38.2B | -70.6% |
| Stock-Based Compensation | $19.5B | — | — |
Valuation vs. Mag 7 Peers
| Metric | AMZN | MSFT | GOOG | META |
|---|---|---|---|---|
| P/E (TTM) | 29.2x | ~31x | ~22x | ~24x |
| Revenue Growth (TTM) | 12.4% | — | — | — |
| Earnings Growth (TTM) | 31.1% | — | — | — |
| P/S | 3.1x | — | — | — |
| FCF Yield | 0.5% | — | — | — |
At 29.2x trailing earnings, AMZN is in the middle of the Mag 7 valuation pack. The premium over GOOG (22x) and META (24x) is justified by AMZN's faster earnings growth (31% vs. peers) and AWS's AI tailwind. The slight discount to MSFT (~31x) is justified by Microsoft's higher-margin software model. The 0.5% FCF yield is the only ugly metric, but it's artificially depressed by the capex surge — on a normalized $90B capex basis, P/FCF would be roughly 45x (still rich, but reasonable for the quality).
Balance Sheet — A Fortress
| Item (Dec 31, 2025) | Amount |
|---|---|
| Cash & Equivalents | $86.8B |
| Marketable Securities | $36.2B |
| Total Liquidity | $123.0B |
| Property & Equipment (net) | $357.0B |
| Total Assets | $818.0B |
| Long-term Debt | $65.6B |
| Total Equity (est.) | $286.1B |
| Diluted Shares Outstanding | ~10.66B |
$123B in liquidity against only $65.6B in long-term debt — debt-to-equity is a conservative ~0.23x. Interest coverage is comfortable given $80B in operating income. The $357B in net property & equipment reflects the massive physical infrastructure (data centers, fulfillment centers, logistics fleet) that creates Amazon's deepest competitive moats. This balance sheet can absorb the $128B capex year without breaking a sweat.
Technical Analysis
AMZN closed at $209.20 on March 31, 2026 — down 19.1% from the November 2025 all-time high of $258.60. The stock has been range-bound between $198 and $215 for the last two months after a sharp 20% tariff-driven crash in January–February. This week's 3.8% bounce on Iran ceasefire news is the first attempted breakout from the lower half of that range.
Moving Averages
| Indicator | Value | Price vs. MA | Signal |
|---|---|---|---|
| SMA 10-Day | $213.36 | −2.0% | BEARISH |
| EMA 10-Day | $212.08 | −1.4% | NEUTRAL |
| SMA 50-Day | $222.70 | −6.1% | BEARISH |
| SMA 200-Day | $224.78 | −6.9% | BEARISH |
AMZN trades below every major moving average. The 50-day and 200-day SMAs are converging around $223–225, suggesting a potential death cross if the downtrend continues. The bearish posture is real — but the stock is approaching the SMA10/EMA10 from below for the first time in weeks, and a sustained move above $215 would flip the short-term trend.
Momentum Indicators
| Indicator | Value | Signal |
|---|---|---|
| RSI (14-period) | 51.47 | NEUTRAL |
| MACD Line | −1.83 | IMPROVING |
| MACD Signal | −2.88 | BULLISH CROSS |
| MACD Histogram | +1.04 | POSITIVE |
The momentum picture is more constructive than the moving averages suggest. RSI at 51 sits dead-center neutral — neither overbought nor oversold. More importantly, the MACD line (−1.83) just crossed above the signal line (−2.88), printing the first bullish MACD crossover since the January–February sell-off. The histogram has flipped positive at +1.04, confirming the momentum shift. These are early signals, but they suggest selling pressure has eased.
Key Technical Levels
| Level Type | Price | Significance |
|---|---|---|
| Resistance 3 (ATH) | $258.60 | All-time high from November 2025 |
| Resistance 2 | $247 | Pre-tariff crash high (Jan 2026) |
| Resistance 1 (200 SMA) | $224.78 | Key reclaim level for trend change |
| Current Price | $209.20 | — |
| Support 1 | $198 | Feb 2026 crash low — tested and held twice |
| Support 2 | $196 | 52-week low / psychological support |
| Support 3 | $185 | Next major support if $196 breaks |
Recent Price Pattern
Phase 1 — Rally to ATH (Oct 2023 — Nov 2025): AMZN rallied 119% from the $118 low to the $258.60 ATH, driven by the AI narrative, AWS re-acceleration, and margin expansion. Clean uptrend with higher highs and higher lows.
Phase 2 — Tariff Crash (Jan — Feb 2026): A sharp 20% decline from $247 to $198 in approximately 3–4 weeks, triggered by tariff fears and Q4 earnings concerns about the $128.3B capex disclosure. Volume spiked on the sell-off, indicating institutional distribution.
Phase 3 — Consolidation (Feb — Mar 2026): The stock has been range-bound between $198 and $215 for two months. This sideways action is constructive — sellers are exhausted near $198 and buyers are accumulating in the low $200s. The base is forming a potential platform for the next move.
Phase 4 — Bounce (This Week): The 3.8% move to $209.20 on Iran ceasefire news broke the stock out of the lower half of the consolidation range. If sustained above $210–215, this represents a constructive shift.
SEC Filings Deep Dive
I read every page of the FY2025 10-K, the most recent annual filing for Amazon.com, Inc. (CIK: 0001018724, SIC: 5961 — Retail Catalog & Mail-Order). Here are the most material disclosures.
Cost Structure (FY2025)
| Expense Category | Amount | % of Revenue |
|---|---|---|
| Cost of Sales | $356.4B | 49.7% |
| Fulfillment | $109.1B | 15.2% |
| Technology & Infrastructure | $108.5B | 15.1% |
| Stock-Based Compensation | $19.5B | 2.7% |
Cost of sales runs at ~50% of revenue, leaving Amazon with a ~50% gross margin (much higher than retail-only peers because AWS pulls the blended margin up dramatically). Fulfillment at $109B and Technology & Infrastructure at $108.5B are the two largest operating expense lines. Stock-based compensation of $19.5B is meaningful but only 2.7% of revenue — manageable dilution given the earnings growth.
The $128.3B Capex Story (From the 10-K)
Risk Factors From the 10-K
| Risk | Details |
|---|---|
| Capital Investment Returns | Filing explicitly acknowledges that substantial technology infrastructure investments may not generate anticipated returns. Critical given the $128.3B figure. |
| Competition | Walmart/Shopify in e-commerce, Azure/GCP in cloud, Netflix/Disney+ in streaming, Google/Meta in advertising. Constant aggressive investment required. |
| Regulatory & Antitrust | Ongoing FTC scrutiny, EU Digital Markets Act, GDPR, state-level US privacy laws, international tax challenges. |
| Trade Policy | Tariffs on Chinese goods could significantly impact the third-party marketplace (60%+ of units sold) and consumer affordability. |
| Labor | ~1.5 million employees, second-largest US private employer. Unionization, minimum wage, and labor market tightness all create cost pressures. |
| International FX | 20+ countries; currency fluctuations and geopolitical instability create headwinds for the International segment's 13% growth rate. |
| Technology Infrastructure | Service outages, security breaches, capacity constraints in AWS could damage customer relationships and revenue. Rapid AI infrastructure scaling introduces new operational risks. |
News & Catalysts
Today's Headlines (March 31, 2026)
| Headline | Source | Impact |
|---|---|---|
| "Amazon Stock Is Priced For A Crisis — But Is It 2008 All Over Again?" | Benzinga | Bullish framing |
| "Oil Tumbles, Nasdaq 100 Jumps 3% As Iran Says It's Ready To Halt Hostilities" | Benzinga | Positive catalyst |
| "This Is the Cheapest Magnificent Seven Stock Right Now" | Motley Fool | Bullish narrative |
| "Want AI Growth With Limited Risk? 3 Smart Stocks for Cautious Investors" | Motley Fool | Positive inclusion |
The Iran Ceasefire — Why It Moved AMZN Specifically
Iran signaling readiness to halt hostilities drove a broad market rally with the Nasdaq 100 jumping 3%. AMZN rose 3.8%, slightly outperforming. The catalyst matters more for Amazon than for many Mag 7 stocks because:
- Lower oil prices directly reduce shipping and logistics costs across Amazon's massive fulfillment network
- Consumer confidence improves in a de-escalation scenario, supporting discretionary spending on Amazon's marketplace
- Risk-on sentiment lifts mega-cap tech as institutional investors rotate back into growth
- Supply chain stability improves with reduced geopolitical risk in Middle Eastern shipping lanes
"Cheapest Magnificent Seven" Narrative
The Motley Fool article positioning AMZN as the most attractively valued among the Mag 7 (AAPL, MSFT, GOOG, AMZN, META, NVDA, TSLA) is gaining traction across multiple financial media outlets. At 29.2x trailing P/E with 31% earnings growth, AMZN does have a compelling PEG ratio compared to peers — it's growing earnings faster than any of them. This narrative could drive retail investor accumulation and provides a useful tailwind for the stock at current levels.
Upcoming Catalysts
| Catalyst | Timing | Potential Impact |
|---|---|---|
| Q1 2026 Earnings | Late April 2026 | HIGH — AWS growth and FY2026 capex guidance could move stock 10–15% |
| Tariff Policy | Ongoing | HIGH — Any escalation hits 3P marketplace economics directly |
| Iran Ceasefire | Near-term | MEDIUM — Sustained peace reduces oil/logistics costs |
| AWS AI Product Launches | Ongoing | MEDIUM — New AI services validate the capex thesis |
| Federal Reserve Policy | May/June 2026 | MEDIUM — Rate cuts benefit growth stock valuations |
Market Sentiment
I surveyed Reddit (r/wallstreetbets, r/stocks, r/ValueInvesting, r/options) and Twitter/X for current AMZN sentiment. The picture is split.
Reddit — Cautiously Bearish Short-Term, Mixed Long-Term
| Subreddit | Sentiment | Key Themes |
|---|---|---|
| r/wallstreetbets | NEUTRAL/BEARISH | In WSB Top 10 picks. YTD −12.4%. Frustration with underperformance vs. other mega-caps. |
| r/stocks | BEARISH | "How long are we supposed to wait" (98 upvotes). Opportunity-cost frustration dominates. |
| r/ValueInvesting | DEEPLY DIVIDED | Bulls: "cheapest multiple in 20 years." Bears: "ROIC 5.1% < WACC 10.6% = destroying value." |
| r/options | MINIMAL | Not enough options-specific chatter for a directional read. |
Side-by-Side: The Reddit Bull/Bear Debate
Top Bull Quotes
- "Anything under 200 with 5+ years is a buy" (79 upvotes, r/ValueInvesting)
- "Sum of parts worth 3 trillion" (r/ValueInvesting)
- "World's largest retailer + Top 5 ad biz + world's largest hyperscaler at cheapest multiple in 20 years" (r/ValueInvesting)
Top Bear Quotes
- "Opportunity cost has been massive" (98 upvotes, r/stocks)
- "Amazon spends 60% of FCF on SBC" (52 upvotes, r/ValueInvesting)
- "Robotics cuts are incredibly bearish" (41 upvotes, r/stocks)
Twitter/X — High-Engagement Bull Voices
| Author | Tweet | Engagement | Lean |
|---|---|---|---|
| @StockSavvyShay | "AMZN trading at lowest valuation in more than a decade" | 2,779 likes / 304K views | BULL |
| @Sam_Badawi | Quoting Bill Ackman: "highest quality businesses at extremely cheap prices" | 392 likes / 91K views | BULL |
| @RealJGBanks | Buy targets: "$AMZN at $175" | 1,416 likes / 149K views | BULL (lower entry) |
| @StockOptionCole | "$AMZN going $170s" | 156 likes | BEAR |
| @Jason Calacanis | 57,000 layoffs in 3 years — headcount concerns | 722 likes / 180K views | CAUTIOUS |
Emerging Twitter Narratives
- Delta Airlines / Project Kuiper: Deal for Amazon's Leo satellite network for in-flight Wi-Fi (WSJ). New revenue stream for Project Kuiper. Bullish.
- AWS Market Share Concerns: Bears are pointing out that Azure is reportedly growing at +39%, Google Cloud at +34%, while AWS is at +24% on a TTM basis. The competitive gap is narrowing. Bearish.
- Fauna Robotics Acquisition: Amazon acquired the maker of consumer humanoid robot "Sprout," signaling entry into the humanoid robotics market. Bullish long-term.
Insider & Institutional Activity
Ownership Snapshot
Top 10 Institutional Holders
| Rank | Institution | Ownership % | Type |
|---|---|---|---|
| 1 | Vanguard Group | 7.91% | Index / Passive |
| 2 | BlackRock | 6.87% | Index / Passive |
| 3 | State Street | 3.64% | Index / Passive |
| 4 | FMR / Fidelity | 3.10% | Active / Mixed |
| 5 | Geode Capital | 2.11% | Index / Passive |
| 6 | Morgan Stanley | 1.51% | Active |
| 7 | JPMorgan Chase | 1.50% | Active |
| 8 | Norges Bank | 1.33% | Sovereign Wealth |
| 9 | T. Rowe Price | 1.23% | Active |
| 10 | Northern Trust | 0.89% | Index / Passive |
Insider Selling — All Routine, Not Discretionary
I parsed 200 insider transactions over five years. The headline number — 0 purchases vs. 200 sales — looks bearish on the surface but is meaningless once you understand the structure. Every single sale is a pre-scheduled Rule 10b5-1 plan execution — automated, set up months in advance, with no discretion at the time of execution.
| Insider | Title | 5-Year Sales | Pattern |
|---|---|---|---|
| Jeff Bezos | Founder / Exec Chair | ~$19.3B | 98% of all insider sale value. Funding Blue Origin and personal ventures. Less than 1% of market cap. |
| Doug Herrington | CEO, Amazon Stores | ~$60M | 2,500 shares on the 1st of every month + quarterly vesting liquidation. Most systematic pattern. |
| Andy Jassy | CEO | ~$50M | 14+ trades via quarterly vesting sales. ~$4M/quarter, no acceleration. |
| Matt Garman | CEO, AWS | ~$26M | ~$3.6M/quarter via 10b5-1. Closely watched given AWS importance — no acceleration detected. |
Risk Factors
| Risk | Probability | Impact | Detail |
|---|---|---|---|
| $128B AI Capex Underperforms | Medium | High | If AI workloads don't materialize at scale, AWS decelerates to ~15%, FCF stays compressed, market de-rates the stock. |
| Tariff Escalation | Medium | High | New or expanded tariffs on Chinese goods crush 3P seller economics (60%+ of units), reduce affordability, compress NA margins. |
| AWS Market Share Loss | Medium | High | Azure (+39%) and GCP (+34%) reportedly outpacing AWS (+24%) on TTM basis. Competitive gap is closing. |
| Macro Recession | Medium | Medium-High | Hits all three segments simultaneously — consumer spending, advertising budgets, enterprise IT. |
| SBC Dilution | Low (ongoing) | Medium | $19.5B/year SBC creates ongoing dilution. If revenue growth slows, SBC % of revenue becomes a bigger concern. |
| Regulatory / Antitrust | Medium | Medium | FTC scrutiny, EU Digital Markets Act, potential business model fragmentation. |
| Iran Conflict Re-escalation | Medium | Medium | Reverses today's gains — oil spikes, consumer sentiment turns, risk-off rotation. |
| Labor Cost Pressures | Low-Medium | Low-Medium | ~1.5M employees; unionization, minimum wage, labor market tightness create ongoing cost headwinds. |
Conclusion & Price Targets
Three-Scenario Price Target Model
| Scenario | Target | Return | Probability | Drivers |
|---|---|---|---|---|
| Bull Case | $280 | +33.8% | 25% | AWS 25%+ growth, capex normalizes to ~$95B, margins expand to 13%, multiple re-rates. |
| Base Case | $240 | +14.7% | 50% | AWS 20% maintained, gradual multiple expansion, steady margin gains, capex eases modestly. |
| Bear Case | $175 | −16.3% | 25% | AI capex fails to deliver, tariff escalation, recession, AWS deceleration to ~15%. |
Expected Value: $240 × 50% + $280 × 25% + $175 × 25% = $233.75 (implied +11.7% upside from current price of $209.20).
Bull vs. Bear Side-by-Side
Bull Case ($280)
- AWS AI dominance materializes — $128B capex looks visionary, AWS grows 25%+, premium margins return
- Capex normalizes — FY2026 capex at $90–100B, FCF recovers to $40–50B, P/FCF de-rates from 200x to 45x
- Margin expansion continues — operating margin reaches 12–13%; each 100bps adds ~$7B operating income
- Iran ceasefire holds — lower oil benefits logistics, boosts consumer spending, supports risk-on rotation
- Advertising growth — high-margin, often-overlooked business expands blended margins
Bear Case ($175)
- AI capex doesn't deliver ROI — enterprise adoption slows, AWS decelerates to 15%, $128B sits underutilized
- Tariff escalation — new China tariffs crush 3P economics, compress North America margins
- Macro recession — hits consumer, advertising, and enterprise IT all at once
- AWS market share loss — Azure +39% and GCP +34% continue gaining ground, narrative turns bearish
- SBC dilution — $19.5B/year SBC becomes a bigger drag if revenue growth slows
The Central Debate — $128.3B Capex
Action Plan
| Investor Profile | Action |
|---|---|
| Existing Holders | Hold. Do not add aggressively at $209. Wait for Q1 earnings clarity in late April before reassessing. |
| New Buyers | Scale in over 3 tranches: 1/3 at $209, 1/3 at $198 support test, 1/3 reserved for post-earnings clarity. |
| Options Traders | Sell put credit spreads below $195 support — consolidation range and elevated IV ahead of Q1 earnings favor premium sellers. Strategies like the cash-secured puts strategy work well here. |
| Long-Term Investors | This is a reasonable entry point for a multi-year hold. Quality is excellent, valuation is fair, risk/reward roughly symmetric. Do not chase. |
Final Verdict
Frequently Asked Questions
Is AMZN a good stock to buy in 2026?
AMZN is a fair-value buy for long-term investors but not a conviction trade at $209. The Amazon stock analysis here lands on a HOLD rating because the business is exceptional — $717B revenue growing 12%, AWS at +20%, operating margin at 11.2%, $123B in liquidity — but the 29.2x P/E already prices in most of the good news. The 19% pullback from the November 2025 ATH has improved the risk/reward, but the $128.3B capex bet creates real uncertainty about FY2026 free cash flow. New buyers should scale in over multiple tranches rather than buy the full position at once.
What is the AMZN price target for 2026?
My 12-month base case target for AMZN is $240 (+14.7% upside), with a bull case of $280 (+33.8%) and a bear case of $175 (−16.3%). The expected value comes out to $233.75, implying +11.7% from the current $209.20 price. Wall Street consensus targets are clustered between $240 and $250, putting my base case in line with the analyst community. The Q1 2026 earnings report in late April is the next major catalyst that could move the stock 10–15% in either direction.
Should I buy or sell AMZN stock right now?
I'd hold existing positions and scale into new positions slowly. Selling at 29.2x with 31% earnings growth would be premature — the underlying business is firing on all cylinders and the valuation is not stretched. But adding aggressively at $209 ignores the real possibility that the stock retests $198 support before the next leg higher. The Q1 2026 earnings call (late April) is the cleanest entry catalyst — wait for management's commentary on AWS growth and FY2026 capex guidance before sizing up.
Why did AMZN drop 19% from its November 2025 high?
Two reasons drove the decline. First, in late January and February 2026, tariff fears triggered a sharp 20% sell-off from $247 to $198 as investors worried about the impact on Amazon's third-party seller marketplace (60%+ of units sourced from China). Second, the Q4 2025 earnings release disclosed a $128.3B capital expenditure figure for FY2025 — a 65% YoY jump that crushed free cash flow from $38.2B to $11.2B. Investors are still digesting whether the AI infrastructure bet will pay off. The stock has since stabilized in a $198–$215 consolidation range and bounced 3.8% this week on Iran ceasefire news.
Is AMZN really the cheapest Magnificent Seven stock?
Yes, by some measures. AMZN trades at 29.2x trailing P/E with 31% EPS growth — the fastest earnings growth in the Mag 7. That gives it the lowest PEG ratio (P/E divided by growth) of the group. By absolute P/E, GOOG (~22x) and META (~24x) are cheaper, but they're also growing earnings more slowly. AMZN sits below MSFT (~31x). The "cheapest Mag 7" narrative is gaining traction in financial media and could provide a tailwind for retail buying at current levels. The catch: AMZN's 0.5% FCF yield (artificially depressed by capex) is the worst of the group.
What happens to AMZN if AWS capex doesn't pay off?
The bear case lands at roughly $175 (−16% from current). If enterprise AI adoption slows and AWS decelerates to 15% growth, the $128B in infrastructure becomes underutilized depreciating assets, FCF stays compressed for years, and the market re-rates the stock to a lower multiple. That's a real downside risk and explains why I'm not at BUY. The mitigating factor: even in the bear scenario, Amazon's $123B in liquidity and $80B in operating income make the business extremely durable. There is no scenario where Amazon "breaks" — only one where the stock underperforms for an extended period while the capex cycle plays out.
For more on the strategies referenced in this report, see my guide to mastering the options wheel strategy and the cash-secured puts strategy — both work well on quality mega-caps like AMZN that trade in defined consolidation ranges. You can also browse my best stocks for the wheel strategy writeup for additional candidates with similar risk/reward profiles.
Sources: SEC Filings (AMZN 10-K FY2025), Finviz, Polygon.io, Google News, Reddit (r/wallstreetbets, r/stocks, r/ValueInvesting, r/options), Twitter/X. Report compiled March 31, 2026.