BROS Stock Analysis: Buy at $47 | $68 Target
Table of Contents
Executive Summary
This Dutch Bros stock analysis covers BROS fundamentals, technicals, SEC filings, market sentiment, and insider activity as of March 2026. Here is the bottom line:
- BUY on the 39% pullback from January highs. BROS is a high-growth, drive-thru-only coffee chain with $1.64 billion in revenue (+28% YoY), 19 consecutive years of positive same-store sales, and a credible path from 1,136 stores to 4,000+ locations. The selloff has compressed the forward P/E to 40.3x with a PEG of 1.56 — expensive, but significantly cheaper than peers like CAVA (~90x).
- Transaction-driven comps are the game-changer. In FY2023, same-store sales were entirely price-driven (+7.2% ticket, -5.7% transactions). By FY2025, the inflection is clear: +2.0% ticket and +5.4% transaction growth. Real customer traffic is increasing, not just pricing.
- The founder selling is the biggest red flag. Travis Boersma liquidated $1.1B+ in stock, taking his ownership from 33.9% to 0.02% over 12 months. This is not a normal diversification — it is a founder walking away from a 34-year-old company.
- Institutions are absorbing the float. Despite Boersma's exit, institutional ownership sits at 91.85% with net +1.77% accumulation. Goldman Sachs upgraded to Buy ($75 PT), Wolfe Research initiated at Outperform ($77 PT), and analyst consensus is Strong Buy with a $76.64 target — implying 62% upside.
- Position sizing matters. With a beta of 2.56, ATR of $2.84 (6% daily range), and 10.18% short float, this is a high-volatility growth stock. The recommendation is a medium-conviction BUY with strict 2-4% portfolio allocation and a hard stop at $42.
| Report | Signal | Key Finding | Weight |
|---|---|---|---|
| Fundamentals | BULLISH | Revenue $1.64B (+28%), EPS $0.63, 19yr positive SSS. Transaction comps +5.4%. Fwd P/E 40.3x, PEG 1.56. | 25% |
| SEC Filings | BULLISH | Revenue 6.9x in 6 years. Never closed a store. Management credibility HIGH. Risks: $821M TRA liability, controlled company. | 20% |
| Technical | BEARISH | Death cross confirmed. Price below all MAs (SMA20 -8%, SMA50 -15%, SMA200 -21%). RSI 35.5. Potential double bottom at $46.52. | 15% |
| News & Events | BULLISH | 89 articles, decisively bullish. Goldman Buy $75, Wolfe Outperform $77. Clutch Coffee acquisition. Food expansion to 300 stores. | 15% |
| Insider/Institutional | VERY BEARISH | Boersma: 33.9% → 0.02% ($1.1B+ sold). TSG7 PE exit ($1.63B). Only $174K in genuine purchases over 5 years. Short float 10.18%. | 15% |
| Sentiment | BULLISH | Named #1 highest conviction growth stock on r/investing (490 comments). Analyst consensus $76.64 (62%+ upside). Valuation anxiety persists. | 10% |
| COMPOSITE | MODERATELY BULLISH | 4 bullish, 1 bearish, 1 very bearish. Weighted composite favors the long side with elevated risk from insider behavior. | 100% |
Investment Thesis
Dutch Bros is a drive-thru-only beverage company founded in 1992 in Grants Pass, Oregon by brothers Dane and Travis Boersma. The company went public on September 15, 2021 at $23/share and has since grown from ~500 stores to 1,136 locations across 25 states, with a long-term target of 4,000+ U.S. locations. I track growth stories like Dutch Bros because they represent the kind of asymmetric opportunity options traders should understand.
The core thesis rests on three pillars. First, Dutch Bros is one of the fastest-growing restaurant chains in America, with FY2025 revenue of $1.64 billion (+28% YoY) and a 5-year revenue CAGR of 38%. The company has never closed a single location — a remarkable track record across 34 years of operation. Second, the transaction comp inflection is real. After FY2023's troubling pattern of price-driven comps (+7.2% ticket, -5.7% transactions), FY2025 delivered +5.4% transaction growth alongside +2.0% ticket — evidence that customers are genuinely choosing Dutch Bros over alternatives, not just paying higher prices. Third, the expansion runway is enormous. With 1,136 of a potential 4,000+ stores built (28% penetration), Dutch Bros has more than a decade of high-teens unit growth ahead. For context, Starbucks operates 16,000+ U.S. locations.
The 39% pullback from the January 2026 high of $77.88 creates the entry opportunity. The selloff was driven by founder Travis Boersma's $1.1B+ liquidation, broader consumer spending concerns, and post-earnings profit-taking — not a deterioration in fundamentals. Q4 FY2025 delivered 29% revenue growth, 143% EPS growth, and 7.7% same-store sales. The risk/reward at $47.30 favors a move toward $68 over the next 12-18 months, with a 2.6:1 reward-to-risk ratio against a $42 stop.
Fundamental Analysis
Revenue & Margin Trends
Dutch Bros has grown revenue from $238M (FY2019) to $1.64B (FY2025) — a 6.9x increase in 6 years. The company operates primarily through company-operated shops (71% of system, 92% of revenue) with a legacy franchise base. Revenue growth has been remarkably consistent: 37%, 52%, 48%, 31%, 33%, and 28% over the past 6 years.
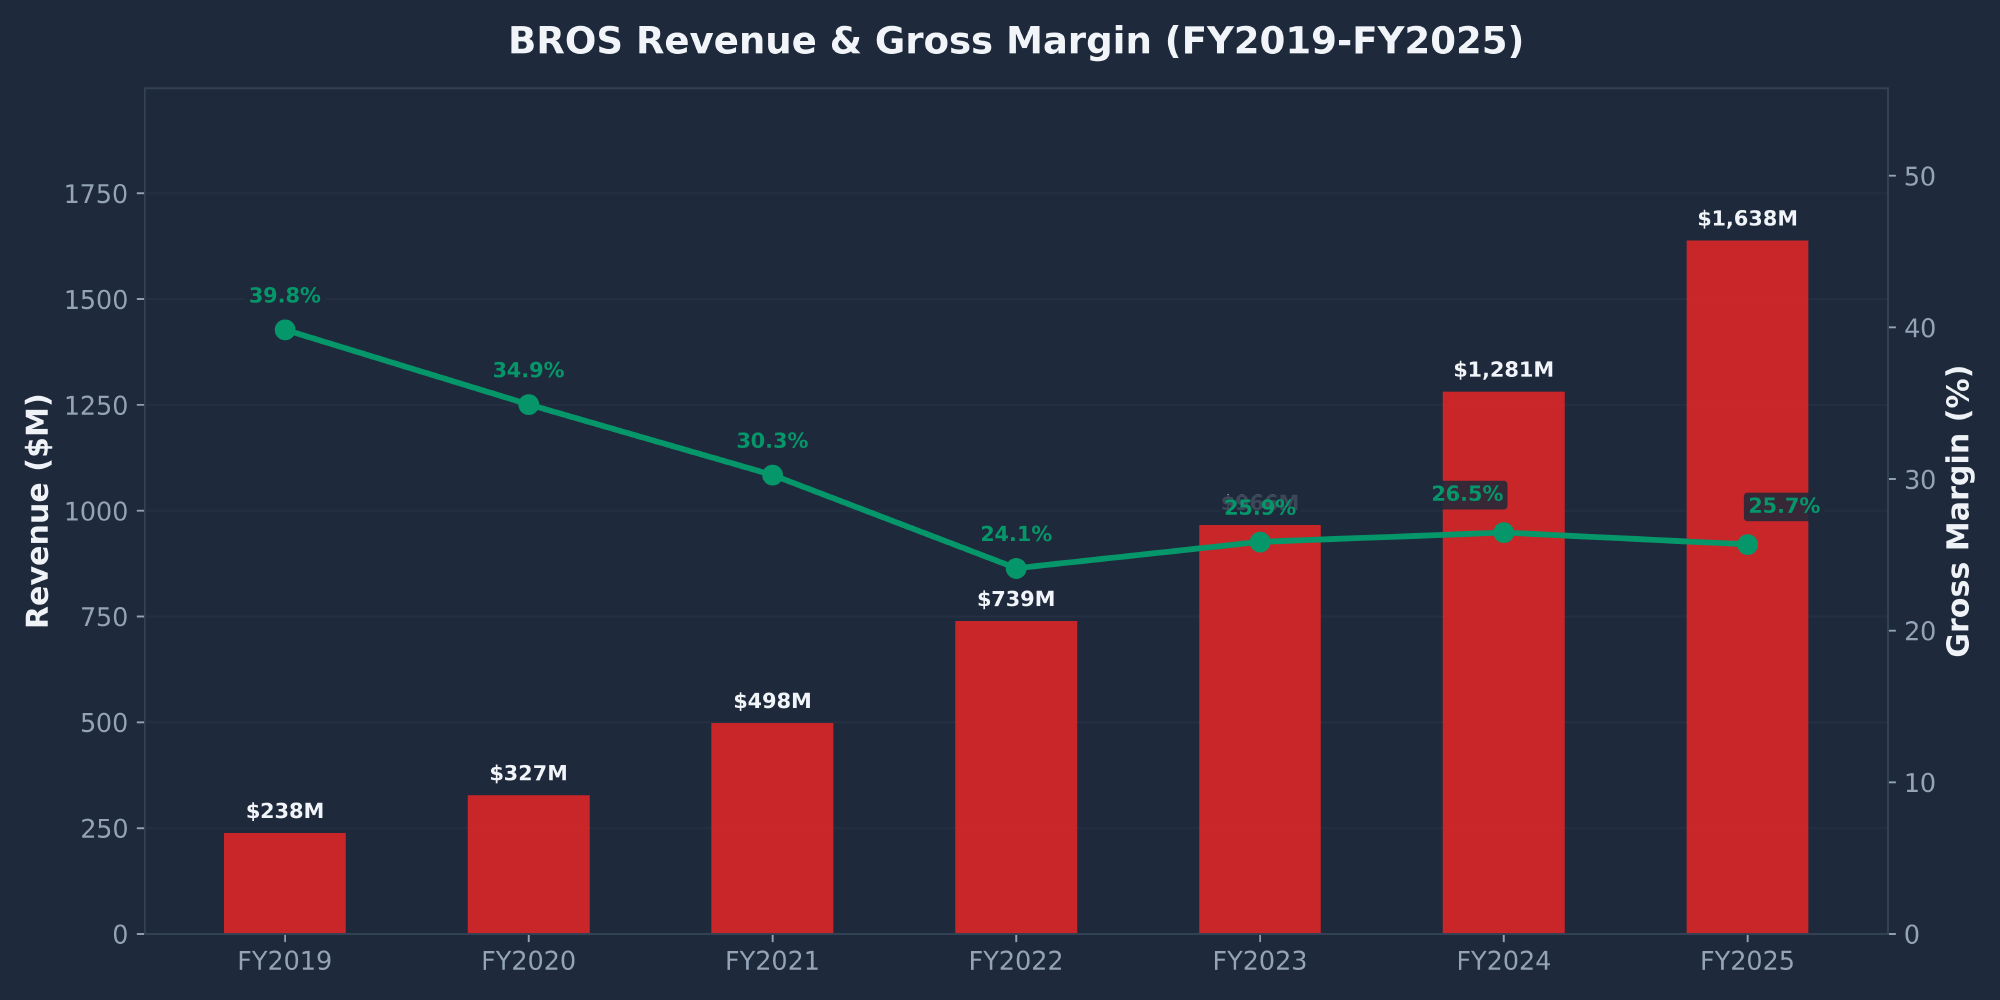
The gross margin compression from 39.8% (FY2019) to 25.7% (FY2025) is entirely structural — driven by the shift from a franchise model (royalty revenue at ~100% margin) to company-operated stores (full revenue capture at ~26% gross margin). This is a deliberate trade: the company earns $1.5M+ per store in revenue vs. ~$40K in franchise royalties. The operating margin tells the real story, expanding from 0% (FY2022) to 9.84% (FY2025) as scale delivers leverage on SG&A (down from 21.2% to 16.0% of revenue).
| Metric | FY2021 | FY2022 | FY2023 | FY2024 | FY2025 |
|---|---|---|---|---|---|
| Revenue ($M) | $498 | $739 | $966 | $1,281 | $1,638 |
| YoY Growth | 52.1% | 48.4% | 30.7% | 32.6% | 27.9% |
| Net Income ($M) | ($13) | ($5) | $2 | $35 | $80 |
| EPS (Diluted) | ($0.25) | ($0.09) | $0.03 | $0.34 | $0.63 |
| Gross Margin | 30.3% | 24.1% | 25.9% | 26.5% | 25.7% |
| Op Margin | -22.3% | 0.0% | 4.8% | 8.3% | 9.8% |
| Adj. EBITDA Margin | 16.5% | 12.3% | 16.6% | 18.0% | 18.5% |
Earnings Trajectory
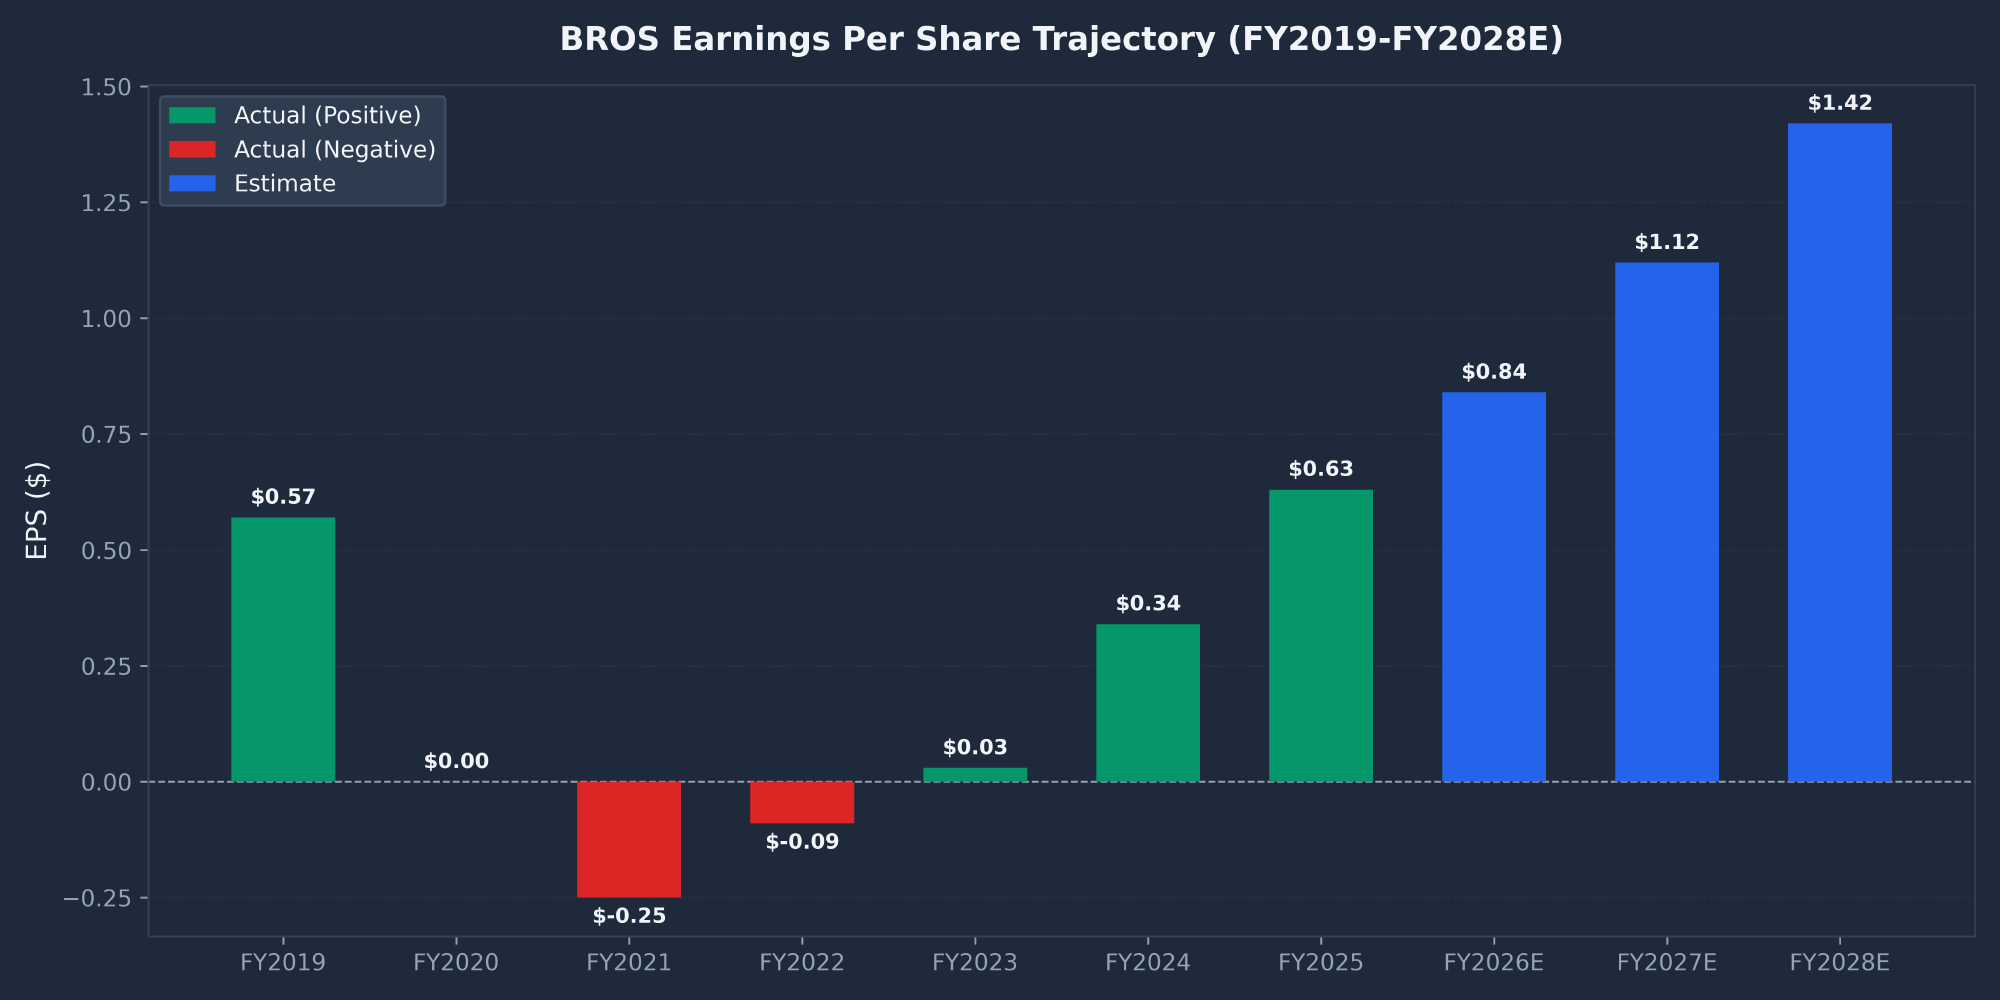
BROS has transitioned from a loss-making, IPO-era company to a profitable growth machine. EPS swung from -$0.25 (FY2021) to +$0.63 (FY2025), and consensus estimates project continued acceleration: $0.84 (FY2026E), $1.12 (FY2027E), and $1.42 (FY2028E). The Q4 FY2025 EPS beat of 89% demonstrated the operating leverage in the model.
Valuation Context
At $47.30, BROS trades at 74.6x trailing P/E and 40.3x forward P/E. That is expensive by absolute standards (restaurant average ~21x), but context matters. The peer comparison tells a clearer story:
| Company | Price | Mkt Cap | Rev Growth | Fwd P/E | Store Growth |
|---|---|---|---|---|---|
| BROS | $47.30 | $7.8B | 28% | 40.3x | 16% |
| SBUX | $99.15 | ~$113B | -2% | ~28x | ~3% |
| CMG | $32.52 | ~$44B | ~14% | ~45x | ~8% |
| CAVA | $82.00 | ~$10B | ~33% | ~90x | ~22% |
BROS trades at less than half CAVA's forward P/E despite similar growth rates and a more established brand. Starbucks commands a 28x P/E with negative revenue growth. The BROS PEG of 1.56 (or ~1.2 on forward estimates with 33% expected EPS growth) suggests the multiple is not unreasonable for the growth rate, though it is far from cheap.
Balance Sheet & Cash Flow
The balance sheet is healthier than the headline debt numbers suggest. BROS ended FY2025 with $269M cash against $148M in term loan debt — net cash positive by $121M. The $500M revolving credit facility is entirely undrawn. However, lease liabilities of $889M and the $821M TRA liability are significant off-balance-sheet obligations.
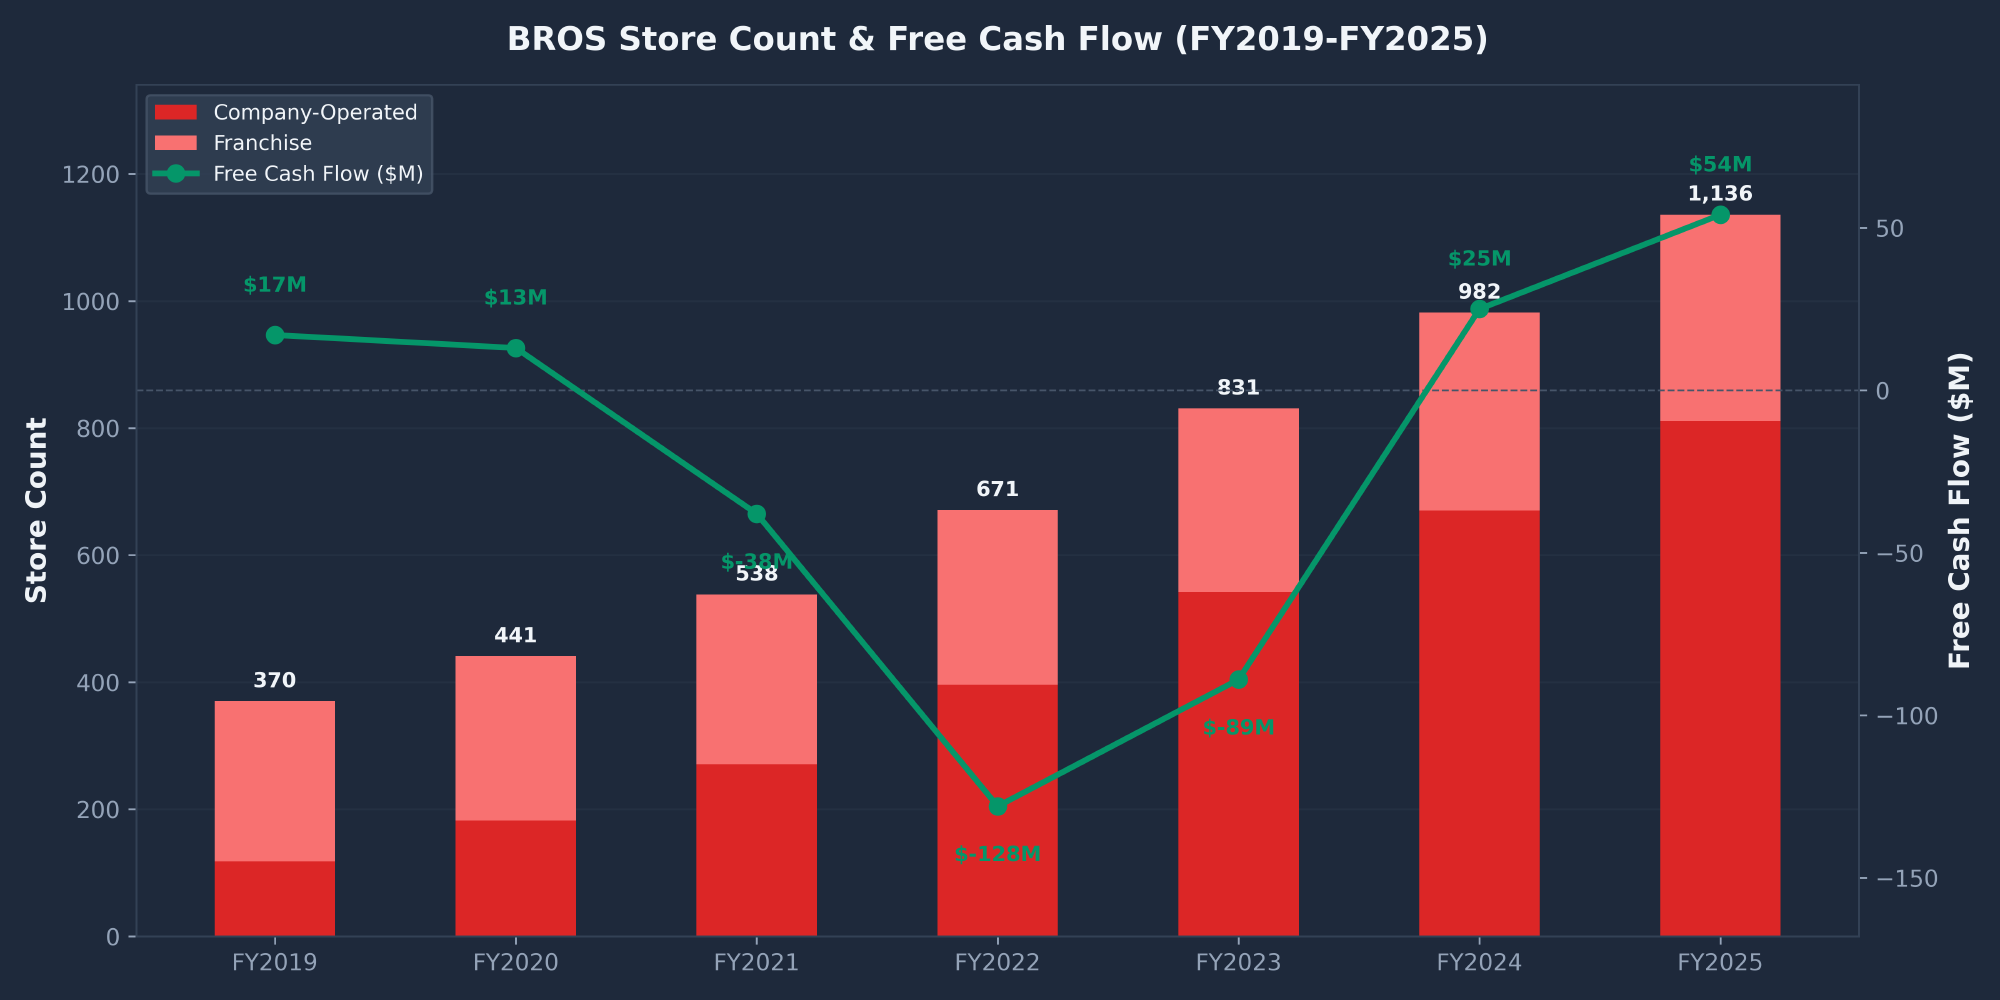
Free cash flow crossed positive for the first time in FY2024 ($25M) and grew to $54M in FY2025. Operating cash flow of $296M comfortably covers the $241M CapEx for 141 new stores. The company is self-funding its growth without issuing new equity — a critical inflection point.
Technical Analysis
BROS is in a pronounced downtrend. The stock is trading at $47.30 — just 1.68% above the 52-week low of $46.52 and 39.27% below the 52-week high of $77.88. All major moving averages are bearishly stacked: price sits below SMA20 (-8.17%), SMA50 (-15.34%), and SMA200 (-21.39%). A death cross (SMA50 below SMA200) has been confirmed.
Support & Resistance Levels
| Level | Price | Significance |
|---|---|---|
| R3 — 52W High | $77.88 | January 2026 high, near all-time high |
| R2 — SMA200 | $60.17 | 200-day moving average, declining |
| R1 — SMA50 | $55.87 | 50-day moving average, declining sharply |
| Current Price | $47.30 | Below all major moving averages |
| S1 — 52W Low | $46.52 | Critical support, tested Feb 24. Must hold. |
| S2 — 61.8% Fib | $43.96 | Key Fibonacci retracement from $23 low to $78 high |
| S3 — Nov 2024 Gap | $33.40 | Pre-earnings gap-up level, gap-fill target |
Momentum Indicators
RSI (14-period) at 35.50 is approaching oversold territory but has not yet breached the 30 threshold. MACD is deeply negative at -1.52 with a fresh bearish re-cross below the signal line on March 13 — selling pressure is re-accelerating after a brief pause. The stock bounced from $46.52 to $54.51 between Feb 24 and Mar 5 (+17%), then rolled back to $47.30 in just 6 sessions. This failed bounce (lower highs, lower lows) is a classic bear market pattern.
Chart Patterns
A double top formed on the weekly chart (September 2025 ~$74, January 2026 ~$78) with a confirmed breakdown below the ~$53 neckline. The measured move target is ~$28. Conversely, a potential double bottom is forming at the $46.52 area (Feb 24 and Mar 13 lows). If the 52-week low holds and price reclaims $54 on above-average volume, the measured move target is ~$62.
SEC Filings Deep Dive
I analyzed 72 SEC filings: 5x 10-K (FY2021–FY2025), 13x 10-Q, 45x 8-K, 4x DEF 14A, and the original S-1. Dutch Bros' CIK is 0001866581.
Store Economics & Unit Growth
Dutch Bros has grown from 370 stores in 7 states (FY2019) to 1,136 stores in 25 states (FY2025). The company has consistently met or exceeded its store opening targets:
| Year | Co-Op Stores | Franchise | Total | New Opens | States |
|---|---|---|---|---|---|
| FY2019 | 118 | 252 | 370 | 42 | 7 |
| FY2021 | 271 | 267 | 538 | 98 | 12 |
| FY2023 | 542 | 289 | 831 | 159 | 16 |
| FY2024 | 670 | 312 | 982 | 151 | 18 |
| FY2025 | 811 | 325 | 1,136 | 154 | 25 |
Average unit volume (AUV) has climbed from $1.64M (FY2019) to $2.12M (FY2025), exceeding the $1.7M S-1 target by 24%. Company-operated contribution margin held at 28.9% (slightly below FY2024's 29.7% due to rising coffee costs). The company has never closed a single location in 34 years of operation.
Same-Store Sales — The Transaction Inflection
The single most important trend in the filings is the shift from ticket-driven comps to transaction-driven comps:
| Metric | FY2023 | FY2024 | FY2025 |
|---|---|---|---|
| Systemwide Same-Shop Sales | +2.8% | +5.3% | +5.6% |
| Co-Op Same-Shop Sales | +1.5% | +6.8% | +7.4% |
| Ticket Growth | +7.2% | +5.3% | +2.0% |
| Transaction Growth | -5.7% | +1.5% | +5.4% |
| Dutch Rewards % of Txns | 65% | 68% | 72% |
Management Credibility
Management credibility rates HIGH. The CEO transition from Joth Ricci to Christine Barone (ex-CEO True Food Kitchen, ex-Starbucks) was well-planned (announced Aug 2023, effective Jan 2024). Under Barone's leadership, transaction comps inflected positive, the mobile order platform launched to 95%+ of shops, and margins improved. Store opening targets have been consistently met. The CFO transition to Joshua Guenser (Dec 2023) has been smooth. Critically, CEO Barone and CFO Guenser have not sold a single share — they have only exercised options.
Red Flags from Filings
Other filing red flags: pre-opening costs nearly doubled from $96K/shop (FY2023) to $180K/shop (FY2025), driven by eastern expansion travel costs. Boersma retains 74.6% voting power despite 0.02% economic ownership, making Dutch Bros a controlled company exempt from certain NYSE governance requirements. SBC normalized from the $158M IPO-year spike to a reasonable $18M (1.1% of revenue) in FY2025.
News & Catalysts
I analyzed 89 articles from the period Feb 13 – Mar 15, 2026. The coverage was decisively bullish with three dominant narratives: the Clutch Coffee acquisition, an analyst upgrade avalanche, and the food menu expansion.
Analyst Ratings
| Date | Firm | Action | Rating | Price Target | Upside |
|---|---|---|---|---|---|
| Mar 9 | Wolfe Research | Initiate | Outperform | $77 | +63% |
| Mar 9 | Piper Sandler | PT Cut | Neutral | $59 | +25% |
| Mar 8 | DA Davidson | Initiate | Buy | $67 | +42% |
| Mar 1 | Goldman Sachs | Upgrade | Buy | $75 | +59% |
| Jan 26 | Citi | Maintain | Buy | $82 | +73% |
| Oct 22 | Barclays | PT Cut | Overweight | $65 | +37% |
| Mar 24, '25 | Morgan Stanley | Maintain | Overweight | $82 | +73% |
Consensus: Strong Buy (1.17 rating). 17 analysts carry a consensus target of $76.64, implying 62% upside. Only Piper Sandler holds a Neutral rating. The range is $59–$82, with every single target above the current price.
Key Catalysts
Clutch Coffee Acquisition: Dutch Bros acquired Clutch Coffee's 20 locations in the Carolinas, giving the company an instant East Coast footprint. This bypasses years of organic build-out and signals management's willingness to use inorganic growth to accelerate the 4,000+ store target.
Food Menu Expansion: Hot food is rolling out to 300 stores after pilot locations showed a 4% comparable-store sales lift. For context, Starbucks derives ~20% of revenue from food vs. BROS at <2%. If food scales to even 10% of mix, it meaningfully accelerates AUV growth — a potential $0.10-0.15/share in incremental EPS by FY2028.
S&P MidCap 400 Inclusion: BROS was added to the S&P MidCap 400 on January 30, 2026, attracting passive index fund flows and institutional capital.
Upcoming Events
| Timing | Event | Potential Impact |
|---|---|---|
| Q1 2026 | Investor Day | Updated store target (potentially 5,000+), margin roadmap, East Coast traction data |
| ~May 2026 | Q1 FY2026 Earnings | First quarter reflecting Clutch acquisition. Guided 3-5% SSS, 22-24% revenue growth. |
| H1 2026 | Food Menu to 300 Stores | 4% comp lift in pilots. Scaling execution and margin impact closely watched. |
| FY2026 | 181+ New Stores | Management guided 181+ net new stores. Unit economics and eastern AUVs key. |
Market Sentiment
Internet sentiment is moderately bullish with significant valuation anxiety. The core tension: undeniable fundamental strength (28% revenue growth, 19-year SSS streak, 89% EPS beat) colliding with a 74.6x trailing P/E that makes value investors uncomfortable.
Reddit Sentiment by Community
| Subreddit | Activity | Tone |
|---|---|---|
| r/investing | MODERATE | BROS named #1 highest conviction growth stock in a 490-comment thread. Mainstream investors warming up. |
| r/wallstreetbets | HIGH | Classic WSB polarity. "BROS is Going to go Orbital" (110 comments) next to "F*** $BROS" (60 comments). YOLO bulls vs. frustrated bagholders. |
| r/stocks | MODERATE | Solidly interested. "Dutch Bros Stock" drew 140 comments with balanced growth vs. valuation discussion. |
| r/ValueInvesting | HIGH | Most skeptical community. Deep-dive posts questioning 112-115x P/E. "Is it the next Starbucks?" provokes heated debate. |
Community Bull Case
- 1,136 stores → 7,000 TAM (only 16% penetration)
- AUV exceeds SBUX at $2.1M vs $1.8M
- 19 consecutive years positive SSS
- Q4 EPS beat by 89%
- PEG of 0.34 on one analysis; analyst consensus 62% upside
- Starbucks weakness = BROS opportunity
- Gen Z cult-like brand loyalty
Community Bear Case
- P/E of 74-115x vs. restaurant average of 21x
- Founder dumped $1.1B+, owns 0.02%
- CAVA-style crash risk (CAVA fell 50% from highs)
- "More dessert than coffee" — sugar regulation risk
- Pacific NW culture may not translate East
- EBITDA margin decline guided for FY2026
- ROIC of 4.62% below cost of capital
Insider & Institutional Activity
The insider profile is one of the most bearish in the market. Over 5 years: 149 total insider trades, only 2 genuine open-market purchases totaling $174K against $2.7B+ in selling. The buy-to-sell dollar ratio is essentially infinity to one.
Founder Liquidation Timeline
Travis Boersma — co-founder and Executive Chairman — systematically liquidated his entire position between late 2024 and November 2025. He sold via DM Trust Aggregator and DM Individual Aggregator LLCs under 10b5-1 pre-arranged plans. His average sale prices ranged from $75.50 (Feb 2025) down to $55 (Nov 2025). At today's $47.30, every sale looks prescient.
| Period | Amount Sold | Avg Price | Decline Since |
|---|---|---|---|
| Feb 2025 | ~$306M | $74-$77 | -37.4% |
| May 2025 | ~$235M | $66-$70 | -30.4% |
| Aug 2025 | ~$282M | $64-$69 | -28.9% |
| Nov 2025 | ~$274M | $53-$57 | -14.0% |
Additionally, TSG Consumer Partners (TSG7), the pre-IPO PE firm, completed their exit with ~$1.63B in total sales across 6 block trades from Mar 2022 to Dec 2023. This is expected PE exit behavior.
Top Institutional Holders
| Institution | % Ownership | Type |
|---|---|---|
| Vanguard Group | 8.73% | Index / Passive |
| BlackRock | 5.76% | Index / Passive |
| FMR / Fidelity | 5.68% | Active Growth |
| Baillie Gifford | 2.54% | Growth Specialist (Smart Money) |
| T. Rowe Price | 2.22% | Active Growth |
Baillie Gifford (Edinburgh-based growth specialist, early backer of Tesla and Amazon) holding 2.54% is the strongest smart-money bull signal. Thornburg boosted their position by 143.9%, and Aperture Investors holds BROS at 3.7% of their AUM ($26.6M). Net institutional transactions are +1.77% — institutions absorbed Boersma's selling.
Risk Factors
| Risk | Probability | Impact | Details |
|---|---|---|---|
| Valuation Compression | HIGH | SEVERE | At 74.6x trailing P/E, any deceleration triggers multiple compression. De-rating to 35x forward = $29. CAVA corrected 50%+ from post-IPO highs. |
| Founder Liquidation | MEDIUM | SEVERE | Boersma sold $1.1B+ (33.9% → 0.02%). 10b5-1 plans provide plausible deniability, but the optics are terrible. |
| Cultural Scaling Failure | MEDIUM | MODERATE | 32,000+ employees across 25 states. Pacific NW "broista" culture may not translate as brand expands East. If new-market AUVs underperform, the 4,000-store thesis unravels. |
| TRA Liability | LOW | MODERATE | $821M hidden obligation to pay 85% of certain tax benefits to pre-IPO holders. Long-tail cash drain. |
| Competitive Threats | MEDIUM | MODERATE | Scooters Coffee expanding into same drive-thru format. Starbucks under Brian Niccol pivoting to drive-thru and speed-of-service. |
| Consumer Recession | MEDIUM | SEVERE | BROS has never operated through a recession as a public company. Beta 2.56 amplifies downside in risk-off markets. Consumer discretionary spending is first to be cut. |
| ROIC Below Cost of Capital | HIGH | MODERATE | ROIC of 4.62% is below typical WACC of 8-10%. Currently value-dilutive; must improve as stores mature. |
Conclusion & Price Targets
Three-Scenario Earnings Model
| Scenario | FY2027E EPS | Applied P/E | Fair Value | vs Current |
|---|---|---|---|---|
| Bear | $0.82 | 42x | $35 | -26% |
| Base | $1.12 | 60x | $68 | +44% |
| Bull | $1.50 | 55x | $82 | +73% |
Multiple rationale: CAVA trades at ~80-100x forward earnings, CMG at ~45x. I apply 60x for the base case (discount to CAVA for execution risk and insider headwinds), 42x for bear (closer to mature restaurant peers), and 55x for bull (re-rating if food expansion and East Coast traction exceed expectations).
Bull Case ($82)
- SSS sustains 5%+ with transaction growth
- East Coast AUVs reach 85% of western stores
- Food adds $0.10-0.15/share incremental EPS
- Gross margin expands to 28-30%
- Investor Day resets narrative above 4,000 stores
Bear Case ($35)
- SSS decelerates to <3%, transactions flip negative
- Valuation compresses to 35-42x forward P/E
- Eastern expansion underperforms on AUV
- Consumer recession hits discretionary spending
- $46.52 breaks, triggering stop cascades to $35
Position Sizing & Action Plan
| Parameter | Recommendation |
|---|---|
| Portfolio Allocation | 2-4% maximum. Beta 2.56 with $2.84 ATR (6% daily range). Size as high-volatility growth, not core holding. |
| Entry Strategy | Scale in over 4-8 weeks. Buy 1/3 at $47-48. Add 1/3 if tests $44-45 (61.8% Fib zone). Reserve final 1/3 for confirmed bounce above $54 or further weakness near $42. |
| Stop-Loss | $42 hard stop (closing basis). Below 61.8% Fib at $43.96 minus ATR buffer. Risk from entry: -11.2% ($5.30/share). |
| Target 1 | $60 (SMA200 zone) — take 25% off. +27% gain from entry. |
| Target 2 | $68-72 (base case fair value) — take another 25% off. Aligns with 12-month FV. |
| Core Hold | $78-82 (ATH retest / bull case) — hold remaining 50%. Stock was at $77.88 just 7 weeks ago. |
| Options Alternative | Sell cash-secured puts at $42 strike, 45-60 DTE. If assigned, own at thesis-breaker level minus premium. Beta 2.56 = rich options premiums. |
For more on selling put options as an entry strategy, see my guide to mastering the wheel strategy. If you are looking to lower your cost basis using options, BROS' high implied volatility makes it an attractive candidate for premium selling. Check out my analysis of the best stocks for the wheel strategy for more ideas.
For more of my stock research, check out my analysis of TOST (Toast), another high-growth restaurant-adjacent name, or browse all reports on the stock analysis page.
Frequently Asked Questions
Is BROS a good stock to buy?
At $47.30, BROS presents a favorable risk/reward for investors with a 12-18 month horizon and tolerance for high volatility. The company is growing revenue at 28% annually with 19 consecutive years of positive same-store sales and a massive expansion runway from 1,136 to 4,000+ stores. However, the stock trades at 74.6x trailing earnings and the founder has sold virtually his entire position. I rate it a BUY with a $68 price target (+44% upside), but recommend strict position sizing of 2-4% of portfolio with a $42 stop-loss.
What is the BROS price target for 2026?
My 12-month base case price target is $68 (+44% upside), based on FY2027E EPS of $1.12 at a 60x forward P/E multiple. The bull case target is $82 (+73%) if food expansion and East Coast traction exceed expectations. The bear case is $35 (-26%) if growth decelerates and the multiple compresses. Analyst consensus from 17 analysts is $76.64, implying 62% upside. Goldman Sachs targets $75, Wolfe Research targets $77, and Citi targets $82.
Should I buy or sell BROS?
If you already own BROS above $60, consider whether you are comfortable holding through what could be several more weeks of bottoming action. The technicals are bearish (death cross, below all MAs, RSI approaching oversold). If you do not own it, the 39% pullback creates a more favorable entry than any point in the past year. Scale into a position — do not go all-in — and set a hard stop at $42. The risk/reward ratio of 2.6:1 favors buyers, but the insider selling profile demands caution.
BROS stock forecast for 2026 and beyond?
Dutch Bros is on track to reach 1,317 stores by year-end FY2026 (management guided 181+ new openings) and potentially 1,700+ stores by FY2028. Revenue should grow from $1.64B to $2.0-2.1B in FY2026 (guided 22-24% growth) and could reach $2.9B by FY2028 in the base case. EPS is projected to roughly double from $0.63 (FY2025) to $1.12 (FY2027E). Key catalysts include the upcoming Investor Day (potential store target increase), Clutch Coffee integration, food menu expansion to 300+ stores, and continued improvement in transaction-driven same-store sales.
Sources: SEC Filings (EDGAR, CIK 0001866581), Finviz Elite, Polygon.io, Google News, Reddit, Benzinga, Goldman Sachs, Wolfe Research, Citi, Piper Sandler, DA Davidson, Barclays, Morgan Stanley. Report compiled March 15, 2026.