BSP Stock Analysis: Bending Spoons Sell | $36 Target
Table of Contents
Executive Summary
This BSP stock analysis covers Bending Spoons S.p.A., the Milan-based acquirer of mature digital businesses that went public on NASDAQ on July 1, 2026 and has already become one of the most argued-about names in software. At $44.45 the stock carries a $28.24 billion market cap and a $31.92 billion enterprise value, six weeks after pricing its IPO at $29.00.
My verdict is SELL with a 12-month target of $36, roughly 19% below the current price. I want to be precise about what that means: this is a price-and-timing call, not a verdict on the business. Bending Spoons is a genuinely capable operator run by people with real skill and real skin in the game. My judgment is that the stock has moved ahead of the evidence, that two dated binary risks land inside 90 days, and that the entry point here is poor.
- The stock trades above every published price target on Wall Street. All 11 analysts initiated on July 27 in a $35–$45 band, averaging $40.36. At $44.45 the stock sits 9% above consensus and 1.2% below the single most bullish target in existence — and not one estimate has been revised since.
- Organic growth is 6%, and net revenue retention is 94%. The prospectus discloses both. Headline growth of 132% is bought, not earned; the installed base has shrunk in revenue every year disclosed (93%, 91%, 95%, 94%).
- Interest expense now consumes 77.5% of operating income, up from 20.4% in 2023. FY2025 GAAP net income was negative $204 thousand on $1.31 billion of revenue.
- Its first-ever earnings report as a public company is August 13 — six days away — with no beat/miss history, no seasonality baseline, and stale consensus.
- The lock-up can release as early as November 2026, freeing 318.5 million shares — roughly 5.5× the true tradeable float of about 58 million. Screeners report the float about 4× too high, so most investors do not know this.
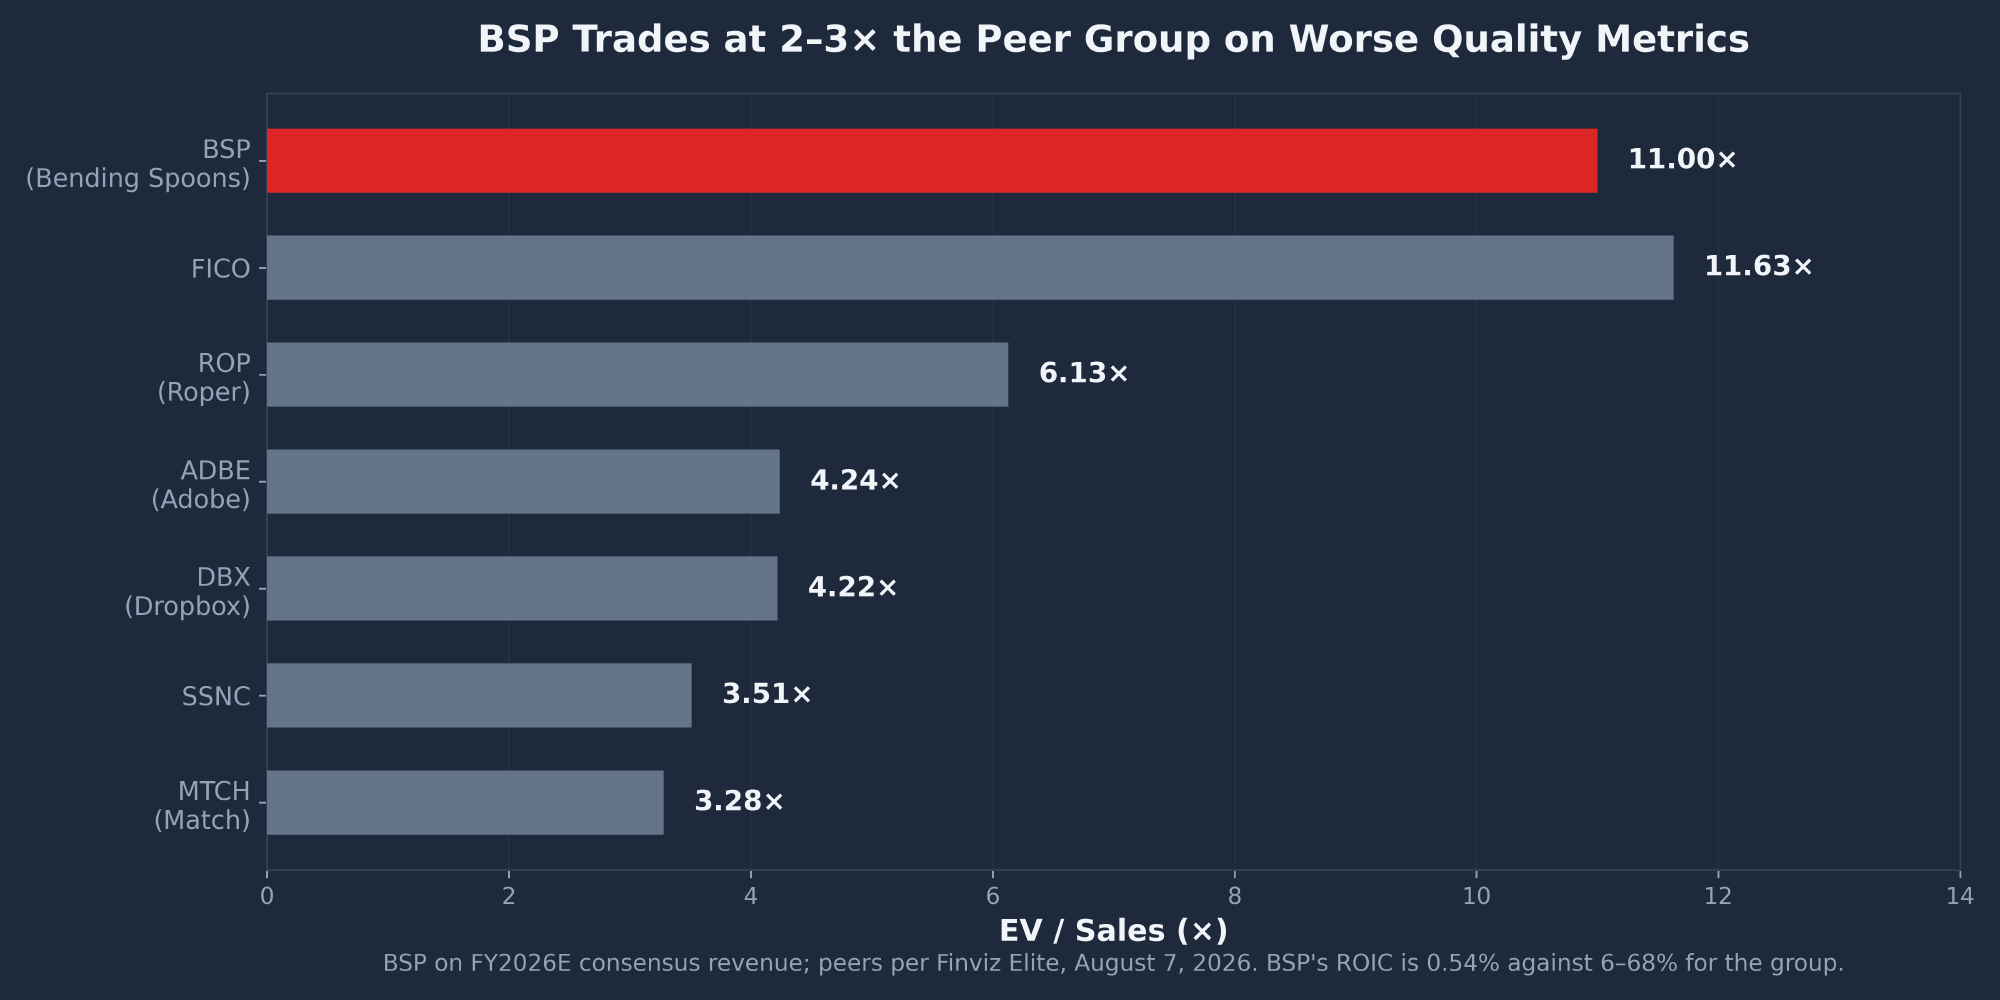
- The valuation is 2–3× the peer group on worse quality metrics: 11.0× FY2026E EV/Sales versus MTCH at 3.3×, SSNC at 3.5×, ADBE at 4.2× and ROP at 6.1× — with return on invested capital that has fallen from 24.9% to 0.5%.
Investment Thesis
Bending Spoons buys mature digital businesses cheaply, cuts most of their cost base, raises prices, and redeploys the cash into the next purchase. The model demonstrably works at the asset level. Remini's revenue is 9× its pre-acquisition level. Evernote's average revenue per user is 2.5× its 2022 level, and the company rebuilt an infrastructure so decrepit — 750 hand-provisioned virtual machines running a Java 11 monolith — that even its loudest public critic credits the turnaround. AOL was bought for 4.4× operating income. Airtable is being bought at 2.7× annual recurring revenue for an asset that peaked at an $11.7 billion private valuation. These are not the actions of a company fooling anyone. They are genuinely good trades.
The problem is that the machine has outgrown the engine underneath it, and the market has now priced the machine as though the engine were the story. Strip out acquisitions and this business grows 6%, with 94% net revenue retention — meaning the customers it already owns generate less revenue each year than the year before.
Every dollar of headline growth is purchased, and it is purchased with debt. Acquisitions ran 21.7× operating cash flow in Q1 2026, funded essentially 100% by new borrowing at an implied 8.3% average rate. Total debt went from $400 million to $4.42 billion in nine quarters. Interest now takes more than three-quarters of operating profit, and the IPO's $933 million of net proceeds went to more acquisitions, not deleveraging.
The gap exists because the market spent five weeks re-rating the stock on one exceptionally well-priced acquisition announcement — a deal that has not closed, whose fastest-growing component (the "Hyperagent" AI platform) was carved out before signing, and which is being bought all-cash onto a balance sheet with negative tangible book value of $6.90 per share.
Meanwhile the disclosure quality does not yet support the price. The company reports material weaknesses across all five COSO components, has never had a Sarbanes-Oxley evaluation performed, and warns that one would likely find more. That is not theoretical: Q1 2026 operating cash flow was overstated by 63% ($123.7 million restated to $75.7 million), with the roughly $48 million imbalance plugged into the foreign-exchange translation line. There is no auditor review report on the interim statements anywhere in the prospectus.
Fundamental Analysis
Bending Spoons was founded in 2013 in Milan by Luca Ferrari (Chair and CEO), Francesco Patarnello (Vice Chair, Head of Business Acquisitions) and Matteo Danieli, from the $40,000 remains of a failed startup called Evertale. The first acquisition cost $10,000. The portfolio today spans AOL, Brightcove, Eventbrite, Evernote, komoot, Remini, StreamYard, Tractive, Vimeo and WeTransfer — plus Airtable, announced August 4, 2026 and pending. The company states it has never sold a material business.
Income Statement — as filed in the prospectus
These are the audited figures from the 424B4 prospectus, which supersede third-party vendor normalizations. Only three fiscal years exist. All figures in USD thousands.
| Line item | FY2023 | FY2024 | FY2025 | Q1 2025 | Q1 2026 |
|---|---|---|---|---|---|
| Revenue | 387,067 | 671,053 | 1,306,404 | 258,946 | 601,321 |
| YoY growth | — | +73% | +95% | — | +132% |
| Organic growth | — | 7% | 13% | — | 6% |
| Gross profit | 236,518 | 428,851 | 857,270 | 165,443 | 408,204 |
| Gross margin | 61.1% | 63.9% | 65.6% | 63.9% | 67.9% |
| Operating income | 84,267 | 127,352 | 277,851 | (4,615) | 120,171 |
| Interest expense | 17,173 | 32,605 | 142,601 | 19,316 | 93,184 |
| Interest as % of operating income | 20.4% | 25.6% | 51.3% | n/m | 77.5% |
| Net income (loss) | 160,643 | 88,997 | (204) | (112,205) | 27,465 |
| Diluted EPS | $0.31 | $0.15 | $(0.00) | $(0.19) | $0.04 |
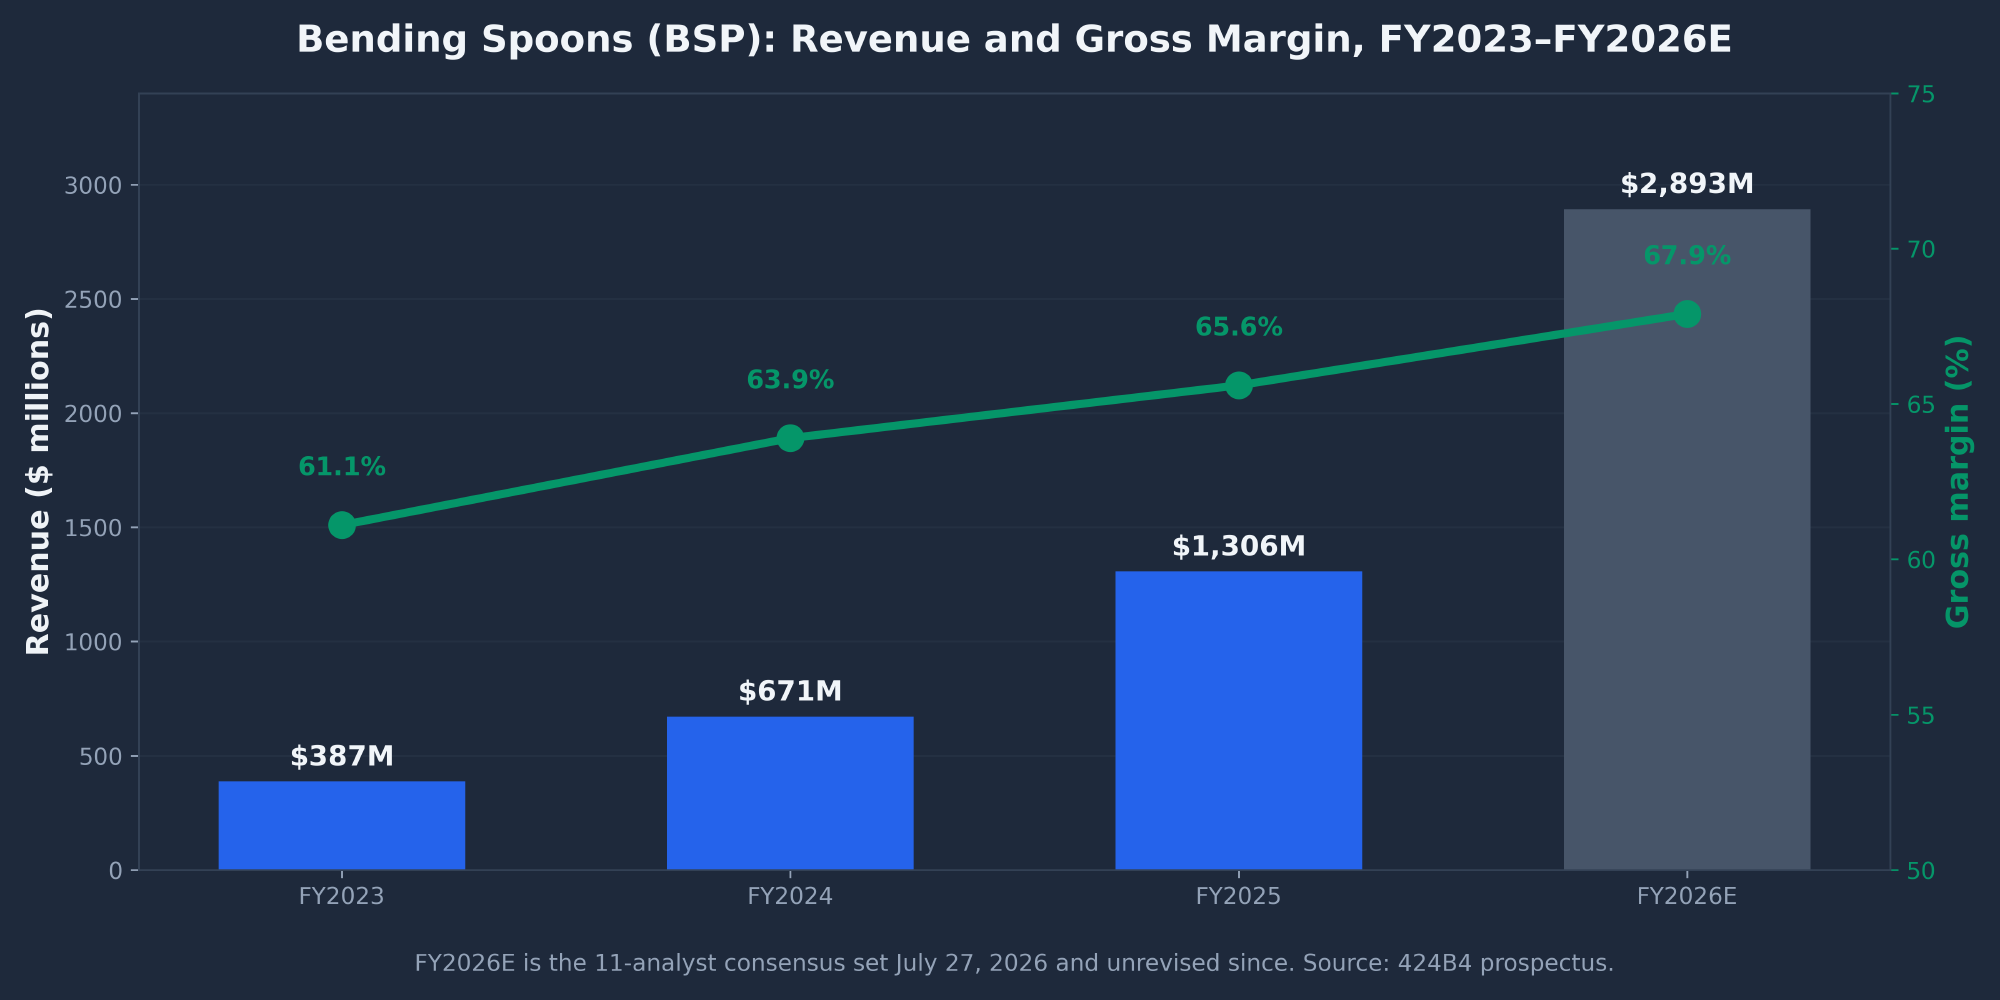
Read that table bottom-up and the story inverts. Revenue nearly doubled every year, which is genuinely impressive. But net income went $160.6 million to $89.0 million to negative $204 thousand. The company grew revenue 3.4× over two years and lost money in the most recent full year. The entire delta is interest expense, which grew 7.0× while operating income grew only 3.3×.
Two accounting notes matter here. First, FY2023's headline 41.5% net margin is an artifact of a $103.1 million deferred-tax benefit, not operations — FY2023 operating income was only $84.3 million. Anyone anchoring on "they used to earn 41% net margins" is reading a tax entry. Second, R&D fell from 13.8% to 9.2% of revenue in FY2025, consistent with the "acquire and harvest, don't reinvest" critique, and a lever that flatters near-term margins at the cost of long-term product competitiveness.
The number that reframes the entire case: organic growth is 6%
The prospectus discloses organic growth separately — 7% in 2024, 13% in 2025 and 6% in Q1 2026 — against headline growth of 73%, 95% and 132%. The 84% revenue CAGR is a capital-deployment statistic, not an operating one. Strip out acquisitions and this is a high-single-digit grower that is decelerating.
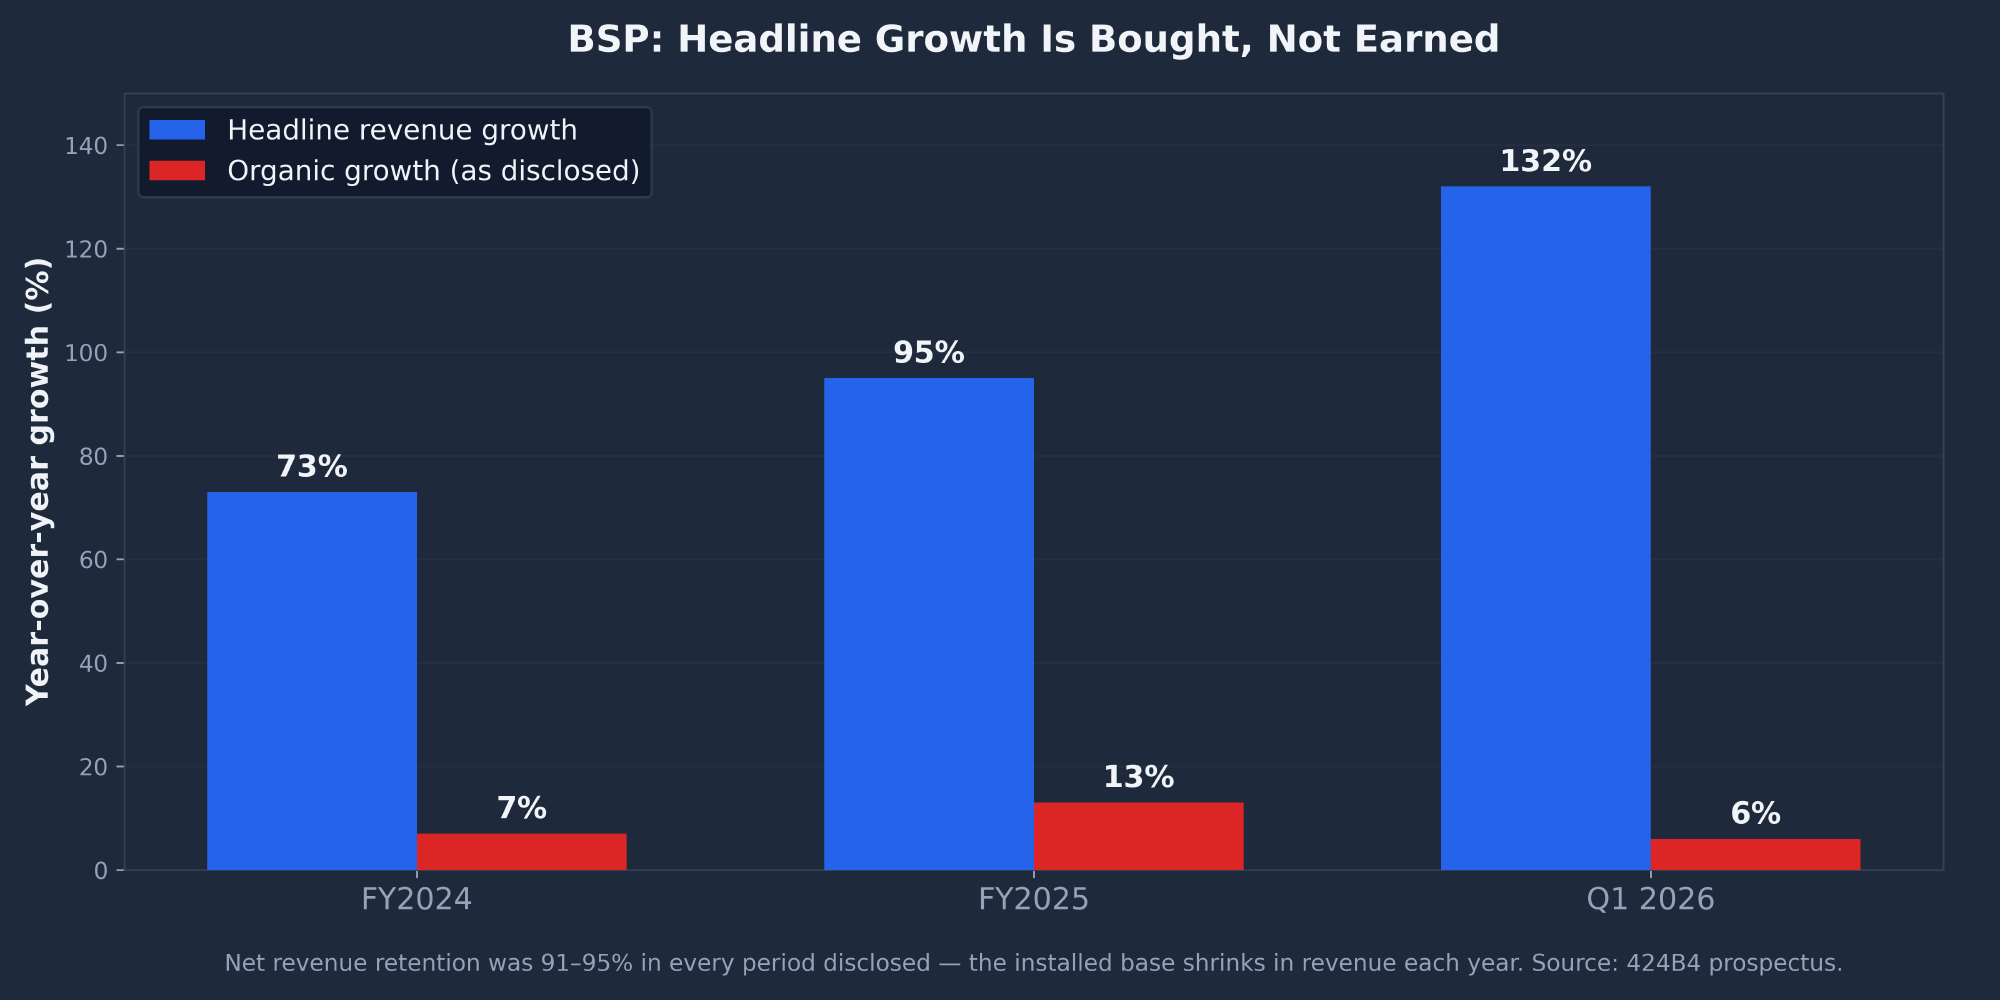
There is a genuine offset worth stating plainly. Some 48% of subscription revenue comes from customers with five or more years of tenure, 28% from ten or more, and the revenue-weighted average tenure is 8.0 years. Organic customer acquisition is 79–83% of new-customer revenue, and advertising expense fell from 9% to just 3% of revenue. This is a loyal, cheap-to-serve base. It is simply shrinking.
Where the profitability actually comes from
Adjusted operating income is 2.2× GAAP operating income, and the add-backs exceed GAAP operating income itself — 121% in FY2025 and 156% in Q1 2026.
| USD thousands | FY2023 | FY2024 | FY2025 | Q1 2026 |
|---|---|---|---|---|
| Operating income (GAAP) | 84,267 | 127,352 | 277,851 | 120,171 |
| + Amortization of acquired intangibles | 33,809 | 85,947 | 150,532 | 69,162 |
| + Transaction-related expense | 848 | 31,952 | 85,466 | 37,893 |
| + Reorganization-related expense | 13,514 | 51,792 | 78,607 | 75,759 |
| Adjusted operating income | 137,441 | 299,481 | 613,247 | 308,011 |
| Adjusted EPS | $0.18 | $0.38 | $0.60 | $0.32 |
| Add-backs as % of GAAP operating income | 63% | 135% | 121% | 156% |
Two of those add-backs are not credibly non-recurring. "Reorganization-related expense" appears in every single period and is rising — $13.5 million, then $51.8 million, then $78.6 million, then $75.8 million in a single quarter — and the prospectus states the company reorganizes "at least with each acquisition." Transaction expense is likewise structural; you cannot be a serial acquirer and call deal costs one-time.
Q1 2026's reported profit is also barely operating profit at all. Of $76.3 million of pre-tax income, $49.3 million came from a single non-operating "other income" line (foreign exchange and derivative marks), of which only $14.7 million is explained. Strip it out and Q1 pre-tax income falls to roughly $27.0 million. Separately, AOL alone contributed $65.5 million of that $76.3 million — 86%.
Balance sheet — every trend runs the same direction
| USD millions | FY2023 | FY2024 | FY2025 | Q1 2026 |
|---|---|---|---|---|
| Intangible assets | 325.99 | 1,222.63 | 3,501.54 | 5,448.57 |
| Intangibles as % of assets | 34.8% | 64.9% | 73.6% | 78.0% |
| Total debt | 400.29 | 877.21 | 2,707.52 | 4,424.83 |
| Total equity | 337.22 | 636.75 | 994.86 | 1,062.69 |
| Tangible book value / share | $0.02 | −$0.92 | −$3.95 | −$6.90 |
| Debt / equity | 1.19 | 1.38 | 2.72 | 4.16 |
| Current ratio | 1.33 | 1.09 | 0.82 | 0.78 |
| ROIC | 24.88% | 6.40% | 0.00% | 0.54% |
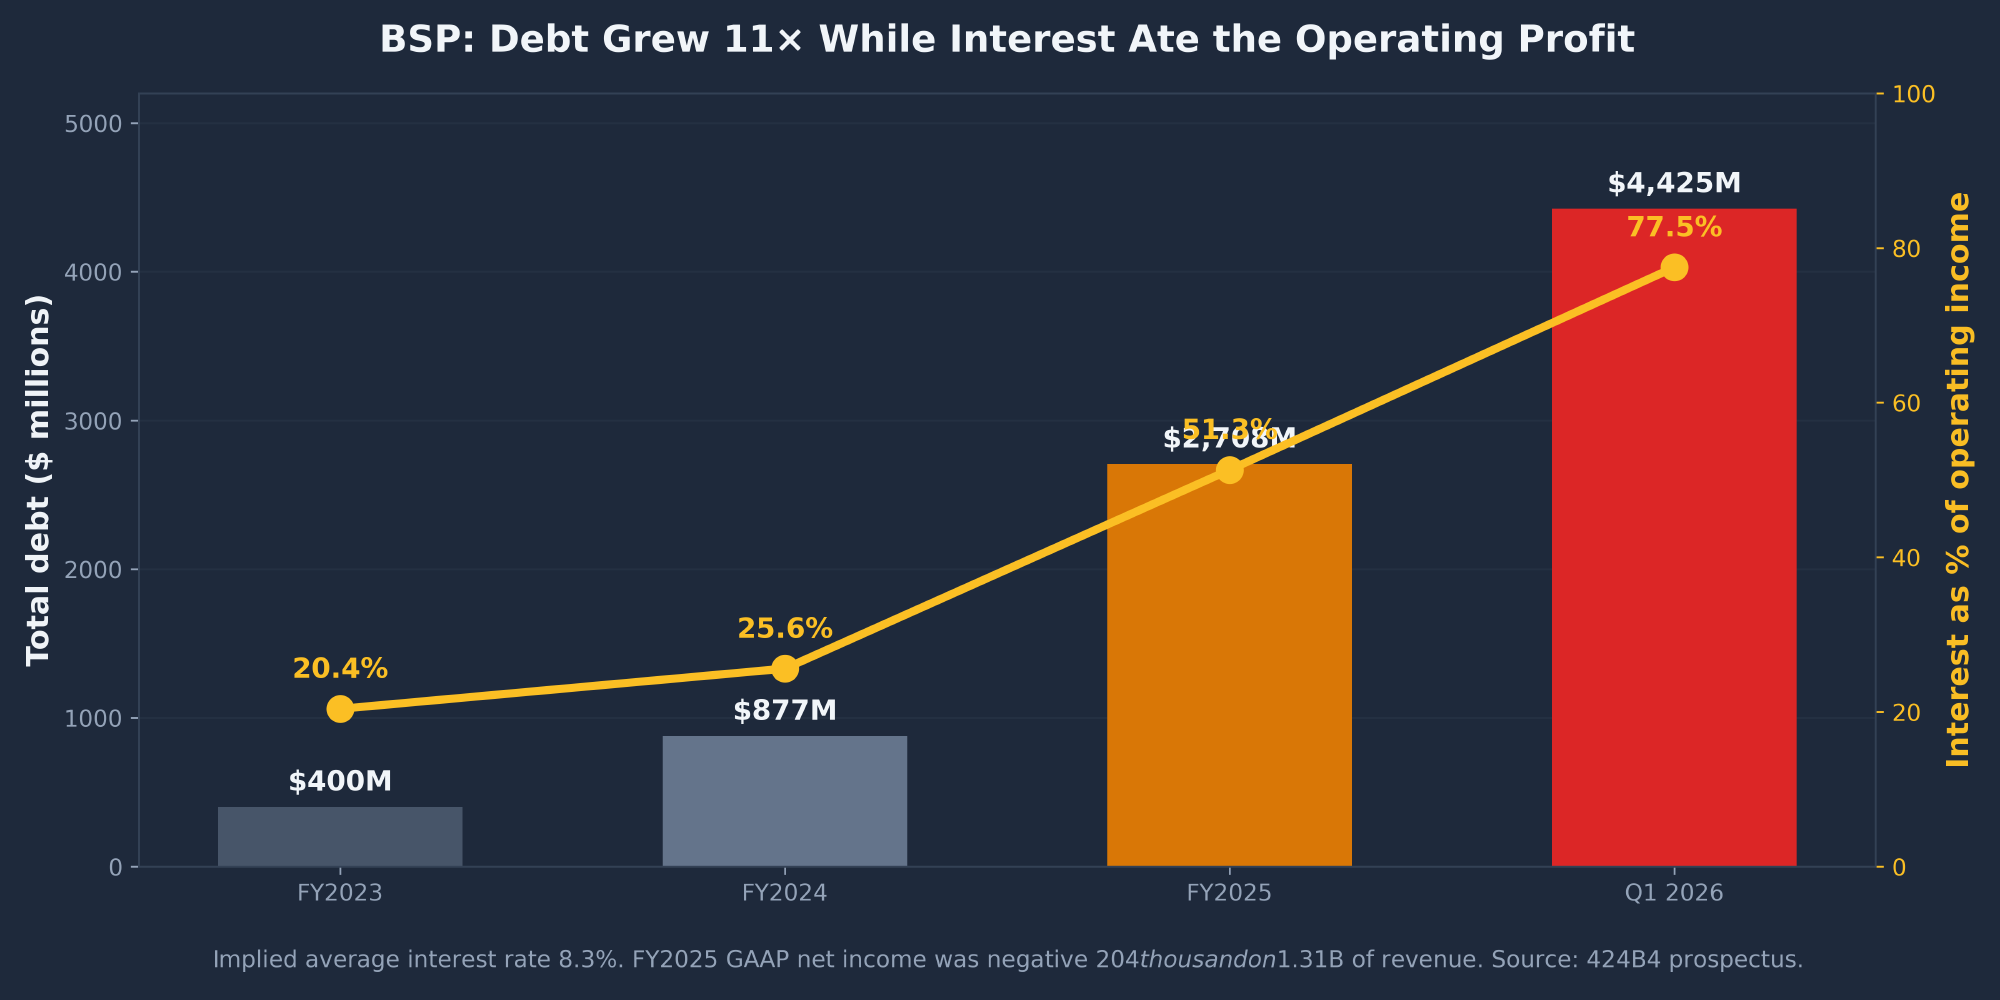
Long-term debt went from $309 million to $3,989 million in roughly 2.25 years, a 12.9× increase. Debt to equity climbed from 1.19 to 4.16. The current ratio fell below 1.0 in FY2025 and now sits at 0.78, meaning negative working capital. And ROIC — the single metric that should validate a capital-allocation story — fell from 24.88% to 0.54%. Net debt is $3,684 million, implying an average interest rate of 8.32%. That is high-yield territory, not investment grade.
The leverage ratio depends entirely on which EBITDA you use
This is the most important reconciliation in the report, and it cuts against the loudest bear claim. Widely circulated retail analysis asserts BSP is levered about 4× and sitting "right at their own covenant ceiling." CEO Luca Ferrari stated publicly on July 31 that the covenant cap is 4.0×, the internal target is about 3.0×, and actual leverage at the end of Q1 2026 was 2.19× — comfortably inside both. The "4×" figure the bears cite appears to be debt-to-equity (4.16), not debt-to-EBITDA. Those are different ratios.
But the reconciliation cuts both ways. For net debt of $3,684 million to represent 2.19× leverage, covenant EBITDA must be roughly $1,680 million — nearly 4× the $434.9 million actually reported for FY2025. That gap is bridged by pro-forma run-rate credit for full-year contributions from AOL, Vimeo and Eventbrite, plus customary covenant add-backs. This is standard leveraged-finance practice and is not improper. But it means the comfortable 2.19× is measured against EBITDA the company has never actually earned in a reported period. An investor's view of the leverage risk here reduces almost entirely to how much credit they give the pro-forma add-backs.
Cash flow — the engine laid bare
| USD millions | FY2023 | FY2024 | FY2025 | Q1 2026 |
|---|---|---|---|---|
| Cash from operations | 59.15 | 204.90 | 290.60 | 75.65 (restated) |
| Free cash flow | 55.11 | 204.29 | 290.10 | 72.42 |
| Cash paid for acquisitions | −170.29 | −889.65 | −1,851.87 | −1,647.94 |
| Acquisitions ÷ operating cash flow | 2.9× | 4.3× | 6.4× | 21.7× |
| % of acquisitions funded by new debt | 22% | 75% | 90% | ~100% |
The business generates real cash, and conversion is structurally good because capital expenditure is negligible — net property and equipment is just $13.3 million, and there is no capitalized software in any period, so R&D is fully expensed. That is conservative and credit-positive. But acquisitions ran 6.4× operating cash flow in FY2025 and 21.7× in Q1 2026 alone, funded essentially entirely by new debt. The compounding flywheel is not self-funding. It is a leveraged acquisition vehicle whose growth rate is a direct function of its access to credit.
Valuation and peer comparison
Finviz reports no trailing multiples for BSP — every TTM field is blank, because only one quarter of public reporting exists. The multiples below are my arithmetic on the reported statements.
| Company | EV/Sales | Fwd P/E | Sales growth | Oper. margin | ROIC | Debt/Equity |
|---|---|---|---|---|---|---|
| BSP | 11.0× | 38.3× | 6% organic | 20.0% | 0.54% | 4.16 |
| MTCH (closest comp) | 3.28× | 11.5× | +1.7% | 28.2% | 21.4% | n/a |
| SSNC (levered roll-up) | 3.51× | 10.2× | +8.6% | 24.4% | 6.1% | 1.17 |
| DBX (Dropbox) | 4.22× | 10.3× | −0.1% | 26.6% | 28.1% | n/a |
| ADBE (Adobe) | 4.24× | 9.6× | +11.5% | 36.7% | 43.4% | 0.61 |
| ROP (the "good" roll-up) | 6.13× | 16.6× | +10.9% | 28.0% | 8.6% | 0.61 |
| FICO (premium quality) | 11.63× | 19.7× | +24.1% | 52.1% | 67.9% | n/a |
BSP trades at FICO's multiple with SSNC's leverage, MTCH's organic growth, and the second-worst ROIC in the group. Applying ROP's 6.13× EV/Sales — a genuinely successful, disciplined, far less levered roll-up — to FY2026E revenue of $2,893 million gives an enterprise value of $17.7 billion, less $3.7 billion of net debt, or about $22 per share. My $36 base case already assumes BSP deserves a substantial premium to Roper.
Analyst ratings — the whole street is below the price
| Firm | Rating | Target | vs. $44.45 |
|---|---|---|---|
| Wells Fargo | Overweight | $45 | +1.2% |
| The Benchmark Company | Buy | $45 | +1.2% |
| Mizuho | Outperform | $45 | +1.2% |
| Goldman Sachs | Buy | $43 | −3.3% |
| BNP Paribas Exane | Outperform | $40 | −10.0% |
| Bernstein | Outperform | $40 | −10.0% |
| Jefferies | Hold | $38 | −14.5% |
| BofA Securities | Neutral | $37 | −16.8% |
| Evercore ISI | In-line | $36 | −19.0% |
| J.P. Morgan | Neutral | $35 | −21.3% |
| Consensus (11 analysts) | 1.82 "Buy" | $40.36 | −9.1% |
Every published price target on Wall Street is at or below the current share price. The highest target anywhere is $45.00; the stock closed at $44.45. Even Goldman Sachs, a lead underwriter and structurally inclined to be constructive, has a $43 target the stock has already exceeded. One important qualifier: all initiations are dated July 27, 2026 — before the August 4 Airtable announcement and the subsequent run. Estimate revisions since: zero up, zero down. The consensus is stale by construction and could be raised. But as of today, there is no published research supporting the current price.
Technical Analysis
| Indicator | Value | Signal |
|---|---|---|
| Last close | $44.45 (−1.55%) | Neutral |
| SMA 20 | $35.31 (+25.9%) | Bullish — very extended |
| EMA 10 | $39.23 (+13.3%) | Bullish |
| RSI (14) | 67.43 | Cooling from 70.16 overbought |
| MACD histogram | +1.5596 | Bullish, but on a 27-session sample |
| ATR (14) | $3.05 (6.86% of price) | Extreme volatility |
| Volume (last session vs 20d avg) | 1.88M vs 2.20M | Bearish — declining into the high |
| % from all-time high ($48.25) | −7.9% | Neutral |
Every momentum indicator is bullish, and every one of them is bullish because of a single event — the August 4 Airtable announcement. The stock is 25.9% above its 20-day average, which is an unsustainable distance. The bullish MACD and RSI readings and the extreme extension are the same fact viewed twice, not two independent confirmations.
The four phases of a 27-day life
| Phase | Dates | What happened |
|---|---|---|
| IPO pop & fade | Jul 1–2 | Opened $31.00, spiked to $43.98, closed $40.50. Next session gave it all back at $35.93 on a −11.3% close. |
| Post-IPO bleed | Jul 6–14 | Seven straight lower highs. Fell −31.5% from the day-one high to an all-time low of $30.11 — below the opening print, leaving every day-one buyer underwater. |
| Base building | Jul 15 – Aug 4 | Fifteen sessions of chop that repeatedly refused to break $32. RSI bottomed at 28.09 on Jul 29. Volume dried up — classic seller exhaustion. |
| Acquisition breakout | Aug 5–7 | Airtable 6-K hit Aug 4; the stock closed +16.8% on Aug 5 on 2.5× volume. Ran to $48.25 on Aug 7 — +60.2% off the low — then reversed to close $44.45. |
Key levels
| Level | Type | Significance | Strength |
|---|---|---|---|
| $48.25 | Resistance | All-time high, set intraday Aug 7 and immediately rejected. Above it there is no chart history at all. | Strong |
| $45.15–$45.98 | Resistance | Aug 6 close and high. The stock failed to hold above here on Aug 7. | Weak-moderate |
| $42.21–$42.60 | Support | Two-session floor of the post-announcement consolidation. The line between healthy consolidation and failed breakout. | Weak — 2 sessions old |
| $37.04–$37.45 | Support | Major confluence. The pre-announcement close, the Aug 5 session low, and the 61.8% Fibonacci retracement all sit here — a full round-trip of the catalyst. | Strong |
| $32.00–$33.05 | Support | The strongest level on the chart. Eleven separate sessions printed lows in this band and it never broke. Three weeks of accumulation. | Very strong |
| $30.11 | Support | All-time low, just below the $31.00 IPO opening print. A break here means the entire public market history is underwater. | Strong |
Technical scenarios
Bullish (~35%)
- Trigger: daily close above $48.25 on volume above 3M, reversing the divergence
- Targets: $52–54 first, then $58–60 on continuation
- Invalidation: loss of $42.21
- Requires volume to re-expand, which it has not done for three sessions
Bearish (~50%)
- Trigger: daily close below $42.21
- Targets: $41.32, then $37.04–$37.45 (the unfilled gap and 61.8% retracement)
- A deeper failure targets the $32–33 shelf, roughly 26% lower
- Volume divergence, rejection candle and SMA20 extension all point the same way
The remaining 15% is a sideways consolidation between roughly $42 and $48 for several weeks while the 20-day average rises to meet price. That is arguably the healthiest outcome for the bull case.
One caveat overrides all of the above. Bending Spoons reports its first-ever public quarter on August 13. A move of 15–20% on the print is entirely consistent with this stock's demonstrated behavior — it has already delivered a +16.8% day and a −11.3% day inside six weeks. Technical levels are of limited use across an event of that magnitude. Any position taken on this setup is, in practice, an earnings bet.
SEC Filings Deep Dive
This section draws on all 30 filings under CIK 0002004711, principally the 424B4 prospectus — a 9.7 MB, 11,416-line document. Bending Spoons is a foreign private issuer, which means it files 20-F annually (due four months after year-end) and episodic 6-K reports rather than 10-K, 10-Q and 8-K. It is exempt from Regulation FD. No 20-F has been filed yet.
Management credibility scorecard
| Dimension | Assessment | Evidence |
|---|---|---|
| Internal controls | Poor | Material weaknesses across all five COSO components. Never had a SOX evaluation performed, and warns one would likely find more. |
| Financial reporting accuracy | Poor | Q1 2026 operating cash flow overstated 63%; sign-convention flips inside single tables; irreconcilable purchase price allocations for the same deals in the same document. |
| Audit committee | Excellent | Chaired by Steve Sinwell (39 years at Deloitte, Vice Chair 2021–23, CPA), with an Italian registered auditor, an ex-Booking Holdings CFO and a 40-year Capital Group veteran. |
| Finance team depth | Thin | Co-CFO responsible for accounting is 34, with a background in AI and software engineering and no disclosed accounting credential — overseeing roughly $2B of quarterly deployment. |
| Executive compensation | Excellent | Total 2025 compensation for all executive officers and directors combined was $10.8M. Employees buy equity by forgoing cash salary; dilution averages just 1.5%/year. |
| Key-person risk | Unaddressed | No employment agreements with the CEO or the head of acquisitions — "they may terminate their relationship with us at any time." No key-man insurance disclosed. |
| Voluntary disclosure | Above requirement | Elected into Section 16(a) Forms 3/4/5 reporting despite the FPI exemption. All 13 directors and officers filed Form 3s. |
The covenant finding — the most under-disclosed fact in the filing
The credit agreement carries a leverage ratio cap, reported at 2.24× for FY2025 and 2.19× at Q1 2026. But the covenant was loosened three separate ways in a single quarter:
| Covenant term | Dec 31, 2025 | Mar 31, 2026 |
|---|---|---|
| Max leverage | 3.25× | 4.00× |
| Add-backs | Transaction + reorganization | Transaction + reorganization + equity compensation |
| Cost savings credit | Expected only | Achieved (retroactive to period start) + expected |
The prospectus body presents 4.00× as though it had always been the limit, citing the 2.24× FY2025 ratio against it — when the covenant actually in force at FY2025 was 3.25×. The string "3.25" appears exactly once in 11,416 lines, buried in a footnote. In fairness, the covenant ratio is not fiction: on a straight GAAP basis, net debt to annualized Q1 2026 adjusted operating income is 2.9×. Real leverage sits in the low 3s — uncomfortable but not distressed. The problem is that the headroom investors are quoted was manufactured partly by renegotiating the limit rather than by deleveraging.
Debt maturity schedule
| Period | Principal ($000) | % of total |
|---|---|---|
| Q2–Q4 2026 | 270,665 | 6% |
| 2027–2028 | 862,559 | 19% |
| 2029–2030 | 802,914 | 18% |
| After 2030 (March 2031) | 2,543,761 | 57% |
| Total | 4,479,899 | 100% |
The debt cliff is real, and it is one date: March 2031. 57% of all principal is bulleted there, and essentially every facility — both term loan Bs, the Euro and USD term loan As, and both revolvers — matures within a 24-day window in March 2031. There is no laddering, and the company is actively moving toward that wall rather than away: the 2024 Euro facility was originally due March 2029 and was extended to 2031 in January 2026.
Acquisition track record
| Target | Closed | Consideration ($000) | % as goodwill | Post-close pre-tax income |
|---|---|---|---|---|
| Evernote | Jan 2023 | 199,692 | 81% | +$11.3M |
| Meetup + StreamYard + Issuu | 2024 | 280,745 | 75% | +$21.7M |
| WeTransfer | Jul 2024 | 476,263 | 70% | −$17M |
| Brightcove | Feb 2025 | 217,798 | 73% | −$23M |
| Loomly + komoot + MileIQ + Harvest | 2025 | 701,253 | 67% | +$27M |
| Vimeo | Nov 2025 | 1,358,688 | 77% | −$47M (5 weeks) |
| AOL | Jan 2026 | 1,454,432 | 58% | +$65.5M |
| Eventbrite | Mar 2026 | 504,601 | 58% | −$31.5M (3 weeks) |
| Airtable | Pending | $1.285B EV | — | ~$480M ARR, +20% YoY |
Every large acquisition arrives loss-making except AOL. The profitable deals are all the small, early ones.
Vimeo, by contrast, looks like the weakest deal in company history. BSP paid $1.36 billion for a business with flat-to-declining revenue that had swung to a $7.0 million operating loss in the nine months before sale, and booked $1.04 billion of new goodwill — 77% of the price. Its intangibles were valued using a multiples-based "comparable approach" rather than an income approach, the softest available method applied to the largest deal the company has ever done.
Goodwill grew from $2.2 million to $3.55 billion in 13 quarters, with one impairment ever — $2.4 million in 2024, on a non-material unit that was then sold. No goodwill is allocated to reporting units: none named, no test date, no headroom disclosed. Combined with a single reportable segment covering 16+ wildly different businesses — from photo apps to GPS pet hardware — impairment risk on any individual business, including Vimeo's $1.04 billion, is untestable from outside.
Governance
Four co-founders hold 100% of the Class A shares, carrying five votes each, giving them 82.68% of the voting power on roughly 48.8% of the economics. Public ordinary shareholders own about 51% of the economics and command 17.3% of the vote. It is stronger than that even sounds: all board members are elected by Class A holders by majority vote, so the founders elect the entire board directly.
As an Italian issuer following home-country practice, the company opts out of several Nasdaq standards. Two matter: Rule 5635(a) (shareholder approval for acquisitions involving issuance of 20%+ of shares) and Rule 5635(c) (shareholder approval for equity compensation plans). Management can issue 20%+ of the company for an acquisition and adopt equity plans with no shareholder vote whatsoever. With Airtable pending and a lock-up carve-out permitting 10% share issuance for M&A, that is not theoretical. There is also no independent compensation committee and no independent nominating committee.
News & Catalysts
Coverage is enormous and extremely recent: of 446 relevant articles reviewed, 361 (81%) fall in the last ten weeks. This is a stock the press discovered in June 2026 and has not stopped writing about since. M&A dominates — roughly 150 unique post-June articles are about Airtable, against about 95 on the IPO. Earnings coverage is exactly one article: the announcement of the date.
The narrative has flipped twice in ten weeks
Phase 1 — "Can this weird Italian thing even work?" (June 8 – July 1). Filing-to-debut coverage was dominated by novelty and skepticism. The Financial Times ("an odd kind of financial magic trick") and Reuters Breakingviews ("asks for suspended disbelief") both questioned the accounting on the same June day. The nicknames were unflattering: "digital junkyard," "internet oldies," "Private Equity Hipsters."
Phase 2 — "Priced for perfection" (July 2 – August 3). With the +39.7% first-day pop banked, coverage turned to valuation and leverage. Forbes ran the hardest hit, from Columbia accounting professor Shivaram Rajgopal: "Paid $3.3 Billion For AOL, Vimeo And Eventbrite. Its Pro Forma 2025 Profit Was Just $22 Million." That is corroborated exactly by the audited numbers.
Phase 3 — "The undertaker with the best balance sheet in software" (August 4 – present). The Airtable deal flipped the narrative from "is this real?" to "this is the new price-setter for stranded SaaS." The Wall Street Journal called it a "kick in the gut" for unicorns; PitchBook asked "80% off. Who's next?" Crucially, the market re-rated BSP upward on this — buying 20%-growth software at 2.7× ARR is exactly the trade the model exists to execute, and doing it as the first post-IPO deal proved the thesis in public within five weeks.
The most valuable source is not English-language financial press
A July 31 interview with CEO Luca Ferrari in Milano Finanza is the only place the company's actual leverage policy is disclosed: a 4.0× covenant cap, a roughly 3.0× internal target, and 2.19× actual leverage at the end of Q1 2026. Ferrari also stated: "Rule number one is not to crash. We have no interest in taking significant risks." He confirmed no dividends, 1,000+ identified targets, and expectations of at least one more acquisition in 2026, "preferably large."
Upcoming catalysts
| Date | Event | Bull outcome | Bear outcome |
|---|---|---|---|
| Aug 13, 2026 | First-ever earnings (Q2), pre-market | Beat, confident guide, organic growth above 8% → $50+ | Miss or vague guide → $36–38 |
| Sep 29, 2026 | Director warrants ($6.20) expire — exercise or lose | First voluntary Form 4; disclosure credibility test | Silence would undercut the governance positive |
| ~Nov 2026 | Lock-up early release — 318.5M shares (~5.5× float) | Orderly absorption; index eligibility improves on real float | Supply overwhelms a thin book → −20% or worse |
| ~Nov 14, 2026 | First-ever 13F institutional ownership data | Broad quality accumulation revealed | Ownership shown to be two funds and a thin tail |
| Nov 24, 2026 | Vimeo copyright trial, Court of Milan (€10,000/day sought) | Dismissed or settled cheaply | Adverse ruling — no accrual has been taken |
| Late 2026 – Feb 2027 | Airtable close (outside date Feb 4, 2027) | Closes early, EBITDA delivered | Regulatory delay or B2B churn |
| H2 2026 | "At least one more acquisition, preferably large" (CEO) | Another 2.7×-ARR bargain | Another Vimeo at 77% goodwill |
One structural note: S&P 500 eligibility is off the table as a foreign private issuer with dual-class super-voting shares. BSP was added to the Nasdaq Composite around July 8, and a Euronext Growth Milan secondary listing went live July 27.
Market Sentiment
Sentiment on Bending Spoons the company is loud. Sentiment on BSP the stock is almost silent. The gap between those two facts is the most useful thing in the sentiment data.
The one US retail thesis that exists is a short. The most rigorous bear note found anywhere — documenting 94% net revenue retention, 6% organic growth and the Endurance International comparison — got 6,100 views and 8 likes. Meanwhile the Airtable announcement from a Bending Spoons executive drew 4.9 million views, and the leading critique from the Pragmatic Engineer newsletter drew 715,000.
Where the two camps diverge
Bulls argue capital allocation
- Airtable at 2.7× ARR, or roughly 7–10× pro-forma EBITDA per Volition Capital's Larry Cheng
- One published model projects ~$369M EBITDA post-restructuring — about 3.5× EV/EBITDA
- They genuinely fix broken infrastructure — conceded by their loudest critics
- Structural cost arbitrage: revenue per employee around $2.5M
- Baillie Gifford and Durable Capital both accumulating
Bears argue durability
- Net revenue retention below 100% in every period disclosed
- Evernote revenue +39% since acquisition on downloads −64%; subscribers estimated down ~50%
- Cost cuts are a one-time step, not a growth engine — earnings are capped by revenue
- The universe of targets big enough to move a $2.6B revenue base is shrinking
- Endurance International ran the same model and went private below its IPO price
The churn narrative — the most distinctive signal in the data
Every single Bending Spoons property has an angry user community, and the anger is monetization-specific — price, cancellation friction, feature removal. That is precisely the failure mode that would break a 4×-levered model built on low churn.
Harvest shows the freshest, cleanest churn evidence: users reporting a "10×-plus price increase" and a comment thread that reads as a live migration queue. Airtable, three days after the announcement, already has B2B seat revenue at risk — one top comment reads "I'm literally expanding Airtable to my entire department this fall. They're going to make me look like an idiot, aren't they." Competitors shipped migration tools within 24 hours. App-store ratings across the portfolio have collapsed:
| App | Lifetime rating | Recent rating | % one-star (recent) |
|---|---|---|---|
| Meetup | 4.3 | 1.7 | 67% |
| Alarm Clock for Me | 4.4 | 2.3 | 54% |
| Evernote | 4.4 | 3.0 | 49% |
| AOL | 4.4 | 2.7 | 42% |
| Weather Live | 4.5 | 3.0 | 38% |
| Remini | 4.6 | 3.5 | 34% |
The sharpest structural version of this point: when a Bending Spoons acquisition of Obsidian was merely rumored, users pre-emptively migrated away. Acquisition targets now have a reason to avoid selling to them, and acquired customers churn on announcement.
The honest counterweight: this churn narrative has been running loudly since 2023 while revenue nearly doubled. The market has so far been right to ignore it. The question is not whether users are angry — they demonstrably are — but whether anger converts to cancellation fast enough to matter against 4× leverage. Net revenue retention of 94% suggests it has already begun.
Insider & Institutional Activity
The single most constructive datapoint in this entire analysis: not one founder, director or executive officer sold a single share into the IPO. All 23,572,375 secondary shares came from financial holders — Galileo Quattordici (11.3M), Baillie Gifford (7.1M), HE Holdco V (2.6M), StarTIP (2.0M) and Tiger Iron (0.56M, a complete exit). Cox Investment Holdings and Durable Capital sold nothing. For a company whose bear case is "the IPO is an insider exit," the ownership record directly contradicts it.
Institutional holders — both added
| Holder | Post-IPO | Per 13G | Change | Value @ $44.45 |
|---|---|---|---|---|
| Baillie Gifford & Co | 36,364,054 | 49,503,716 | +36.1% | $2.20B |
| Durable Capital Partners | 19,591,560 | 23,586,614 | +20.4% | $1.05B |
Baillie Gifford — the Edinburgh long-duration growth manager behind early Tesla and Amazon positions — sold 7.1 million shares into the offering at $29.00 and then bought back nearly twice that in the open market during July, lifting its stake to 15.23%. Durable Capital, run by Henry Ellenbogen formerly of T. Rowe Price New Horizons, took a $1.05 billion cornerstone allocation. One caveat: the prospectus attributes shares to Baillie Gifford Overseas Limited while the 13G is filed by the parent aggregating all group entities, so part of the delta could be group companies absent from the prospectus table. The direction is unambiguous; the exact magnitude carries that caveat.
Data traps — third-party ownership stats are badly wrong here
| Metric | Finviz says | Reality |
|---|---|---|
| Shares float | 230.41M | Wrong by about 4×. It ignores the lock-up entirely. True tradeable float is roughly 58 million shares — the IPO shares, about 17.8% of the ordinary class. |
| Short float | 3.71% | Understated about 4×. 8.54M shares short against the real float is roughly 14.7%. Third-party estimates run higher still. Borrow is reported around 24% with effectively no shortable shares. |
| Institutional ownership | 11.51% | Reconciles exactly — but it is literally just the two 13G filings. No 13F data exists yet. |
| OpenInsider | — | Do not use. Its BSP ticker still maps to a long-dead closed-end fund. Any insider data shown there is a different company. |
The lock-up — the defining supply event
Why this dominates the setup: today's price is set by an artificially thin 58 million-share float. That structural scarcity premium — which is precisely what made the August squeeze possible — mechanically dissipates. The most motivated sellers have already shown their hand: Galileo Quattordici, HE Holdco V, StarTIP and Tiger Iron all sold at $29.00 and are now up 53%. Galileo alone still holds 22.5 million shares; Cox holds 27.0 million and has sold nothing yet. And insider option strikes are $0.06–$1.22 against a $44.45 stock — a cost basis roughly 150–750× below the current price — with monthly vesting restarting August 1, 2026.
Risk Factors
| Risk | Probability | Impact |
|---|---|---|
| 1. The August 13 print disappoints or guidance is vague. No history, stale consensus, stock above every target. | Medium | −15% to −25% in a day (this stock has already printed a −11.3% session) |
| 2. The November supply cliff — the biggest risk. 318.5M shares, ~$14.2B, ~5.5× the true float, releasable 48h after the second earnings release. Roughly 100 days of average volume. | High | −20% to −35% |
| 3. An accounting event. Material weaknesses across all five COSO components, no SOX evaluation ever performed, a 63% cash-flow restatement already on record. | Low-Medium | Severe and non-linear |
| 4. Goodwill impairment. $5.45B of goodwill and intangibles = 78% of assets, tangible book −$4.39B, no goodwill allocated to reporting units, single reportable segment. | Medium (2027+) | High |
| 5. Churn accelerates. App-store ratings collapsing across the portfolio; documented live migrations off Harvest and Airtable; targets now actively avoiding selling to them. | Medium | High — it breaks the whole model |
| 6. Regulatory. Open CFIUS review on AOL; Treasury questions on Eventbrite; Airtable needs clearance; Vimeo copyright trial in Milan on Nov 24 seeking €10,000/day with no accrual taken; ~1,810 CIPA claims and 500 arbitration demands on Eventbrite, also with no accrual. | Medium | Medium |
| 7. Key-person departure. No employment agreements with the CEO or head of acquisitions; no key-man insurance disclosed. | Low | Severe — the strategy is the people |
| 8. Governance. Founders control 82.68% of votes on 48.8% of economics, elect the entire board, and can issue 20%+ of the company for M&A without a shareholder vote. | Certain (structural) | Medium — no recourse on capital allocation |
Conclusion & Price Targets
The adjustment that drives the whole call
Adjusted EPS excludes amortization of acquired intangibles — $231.6 million in the rest of 2026 and $284.5 million in 2027. For a normal software company, adding that back is reasonable. For a company whose entire strategy is buying intangibles, it is adding back the principal cost of doing business.
So I value the company on "honest EPS" — adjusted EPS less half of acquired-intangible amortization, treating half of it as the real, recurring economic cost it is. That is deliberately generous to the bulls; charging all of it would be defensible.
| Year | Adjusted EPS | Amortization/share | "Honest" EPS | Multiple at $44.45 |
|---|---|---|---|---|
| FY2026E | $1.16 | $0.36 | $0.98 | 45.4× |
| FY2027E | $1.84 | $0.44 | $1.62 | 27.4× |
Three scenarios
| Scenario | Prob. | FY27 EPS | Multiple | Target | Return | What has to happen |
|---|---|---|---|---|---|---|
| BEAR | 30% | $1.20 | ~23× | $28 | −37% | Aug 13 disappoints or guidance is soft; Airtable slips on regulatory review; the November lock-up releases 5.5× the float into a thin market. The stock returns to its July $30–33 base. |
| BASE | 45% | $1.62 | 22× | $36 | −19% | Airtable closes and contributes roughly as modelled; organic growth stays 6–8%. The business performs — but the multiple de-rates from 27× toward the low 20s as the market absorbs 6% organic growth, 94% NRR and a doubled float. Fundamentals fine, multiple normalizes. |
| BULL | 25% | $2.00 | 29× | $58 | +30% | Aug 13 beats and management guides confidently; Airtable closes early and delivers the ~$350M EBITDA the bulls model; the lock-up is absorbed without damage; organic growth reaccelerates as AOL stabilizes. The market keeps paying a compounder multiple. |
Probability-weighted expected return: −12%. Upside to the bull case is +30%; downside to the bear case is −37%. You are being offered 0.8 units of upside for every 1.0 unit of downside, on a stock with a 6.86% daily ATR, six days before a binary event it has never been through.
Bull and bear cases
Bull Case ($58)
- They buy assets extraordinarily cheaply — Airtable at 2.7× ARR, an 89% discount to its peak valuation
- Buying at 3.5–10× EBITDA into a vehicle valued at 42× is mechanically, powerfully accretive
- Genuinely good operators, per hostile witnesses — Remini at 9× revenue, Evernote ARPU at 2.5×
- Capex-light: FY2025 capex was $0.57M against $290.6M of operating cash flow
- 1,000+ identified targets; the "SaaSpocalypse" expands the supply of cheap assets
- Baillie Gifford at 15.2% and Durable at 7.3%, both adding; zero insider selling
- An employee equity model — buy in by forgoing salary — that most public companies should copy
Bear Case ($28)
- Interest consumes 77.5% of operating income, up from 20.4% in 2023
- Organic growth 6%, NRR 94% — the installed base shrinks every year
- The model is not self-funding: Q1 2026 acquisitions ran 21.7× operating cash flow, ~100% debt-funded
- 11.0× EV/Sales versus 3–6× for MTCH, SSNC, DBX, ADBE and ROP; ~87× GAAP earnings
- ROIC collapsed from 24.88% to 0.54% — the opposite of a compounding story
- Tangible book value is −$6.90/share; 78% of assets are goodwill and intangibles
- 318.5M shares (5.5× float) can unlock in November
- Comparable roll-ups ended badly — Endurance International, Playtika down 87% from its IPO
What would change my mind
Toward BUY: the stock trades into the $30–32 range; two consecutive quarters of NRR above 100% or organic growth above 12%; the November lock-up passes without a supply shock; a clean SOX remediation with a full audit of internal controls; evidence Airtable's B2B base held after the restructuring.
More bearish: another all-cash deal levered onto this balance sheet before Airtable closes; any further restatement; an AOL revenue decline steeper than 10%; or a covenant renegotiation.
Action plan
| Situation | Action |
|---|---|
| If you own it | Trim or exit into the August 13 print. You are up roughly 53% from the $29 IPO price and 48% from the July low, holding through a first-ever earnings report with the stock above every analyst target. Take the gain. If you want to keep exposure, cut to a third of a position and reassess after November's lock-up. |
| If you don't own it | Do not initiate here. Chasing a 60% run into a binary event, three sessions of fading volume and a rejected all-time high is the worst available entry. Revisit at $30–32, ideally after the November supply event. |
| If you want to short | Be extremely careful — and probably don't. Short interest is already ~15% of the true float, borrow is reported near 24%, and there are effectively no shortable shares. The last widely-read public short was margin-called. The options chain is described as illiquid and untradeable. |
| Sizing if held | 1–2% maximum. A 6.86% daily ATR is 3.5–4.5× a typical large-cap. This stock delivered a −31.5% drawdown and a +60.2% rally inside six weeks. Size it as a speculative position, never a core holding. |
Bottom line
Bending Spoons is a genuinely skilled operator wrapped around a balance sheet and a valuation that have both run ahead of the evidence. The organic business grows 6% with net revenue retention of 94% — the customers it already owns shrink every year — while interest expense consumes 77.5% of operating income and FY2025 GAAP net income was negative. Every dollar of the headline 132% growth was bought with debt at 8.3%, and the market is paying 11× forward sales for it, versus 3–6× for Match, SSNC, Dropbox, Adobe and Roper.
The stock trades above all eleven published price targets, six days before the first earnings report in its history, with 318.5 million shares — 5.5× the real float — able to unlock in November. The Airtable deal at 2.7× ARR is a genuinely good trade, and the founders' refusal to sell a single share alongside Baillie Gifford's 36% open-market add are real signals I take seriously.
But you are being asked to pay a compounder multiple for a leveraged acquirer whose own filings disclose material weaknesses across all five internal-control components and a 63% overstatement of quarterly cash flow. Sell into strength; target $36; revisit with genuine interest in the low $30s.
One note on the divergence in my own research, because it is the honest core of this situation. The two strands built on legally mandated disclosure and real money at risk — the SEC filings and the ownership record — point in opposite directions. The filings say the economics are far weaker than the headlines. The ownership record says the people closest to the company are holding and the smartest outside money is buying. That is why my conviction is MEDIUM rather than HIGH, and why this is a valuation call rather than a fraud call.
Frequently Asked Questions
Is BSP a good stock to buy right now?
Based on this BSP stock analysis, no — BSP is rated a SELL at $44.45 with a 12-month price target of $36, roughly 19% below the current price. The stock trades above all eleven published Wall Street price targets, organic growth is just 6% against 132% headline growth, and interest expense consumes 77.5% of operating income. The entry point is the problem, not the business: at $30–32 this becomes an interesting long. The probability-weighted expected return from $44.45 is −12%, with 0.8 units of upside for every 1.0 unit of downside.
What is the BSP stock price target for 2026?
The Wall Street consensus price target for BSP is $40.36 across 11 analysts, roughly 9% below the current $44.45 price. Individual targets range from $35 (J.P. Morgan) to $45 (Wells Fargo, Benchmark, Mizuho). Every one of those initiations is dated July 27, 2026 and none has been revised since — so consensus is stale and predates the Airtable deal. This Bending Spoons stock analysis sets a base-case 12-month target of $36, with a bull case of $58 and a bear case of $28.
Should I buy or sell BSP stock?
If you own it, trim or exit into the August 13 earnings print — you are up roughly 53% from the $29 IPO price, and holding through a first-ever public earnings report with the stock above every analyst target is a poor risk. If you don't own it, do not initiate here; revisit at $30–32, ideally after the November lock-up event. Shorting is not recommended despite the bearish view: short interest is already about 15% of the true float, borrow runs near 24%, there are effectively no shortable shares, and the options chain is illiquid.
What is the BSP stock forecast for 2026 and beyond?
Two dated events dominate the next 90 days. First, Bending Spoons reports its first-ever quarter as a public company on August 13, 2026, with no beat/miss history and no seasonality baseline — a 15–20% move either way is consistent with this stock's demonstrated behavior. Second, the lock-up can release as early as November 2026 — 48 hours after the second earnings release — freeing 318.5 million shares, roughly 5.5× the true tradeable float. Longer term, the story turns on one variable: whether the next acquisition is as good as AOL or as expensive as Vimeo. Nothing in the current filings resolves that.
Why is Bending Spoons' organic growth so much lower than its headline growth?
Because the growth is bought, not earned. The prospectus discloses organic growth separately — 7% in 2024, 13% in 2025 and 6% in Q1 2026 — against headline growth of 73%, 95% and 132%. The difference is acquisitions. Net revenue retention has been below 100% in every year disclosed (93%, 91%, 95%, 94%), meaning the customer base Bending Spoons already owns generates less revenue each year than the year before. The 84% revenue CAGR is a capital-deployment statistic, not an operating one.
If you are looking at BSP for an options income strategy, it is a poor candidate. The options chain is described as illiquid and effectively untradeable, and a 6.86% daily ATR is 3.5–4.5× a typical large-cap — both of which work against the mechanics I cover in my guide to the options wheel strategy and in selling cash secured puts. For names that actually suit that approach, see the best stocks for the wheel strategy. And if you already hold BSP above the current price, lowering your stock basis using options is a more realistic path than waiting for a re-rating.
Sources: SEC Filings (CIK 0002004711), Finviz Elite, Milano Finanza, Financial Times, Forbes, Wall Street Journal, Business Wire, Reddit, Twitter/X. Report compiled August 7, 2026.