DIS (Disney) Stock Analysis: Buy at $99 | $120 Target
Table of Contents
Executive Summary
This DIS stock analysis covers The Walt Disney Company's fundamentals, technicals, SEC filings, market sentiment, and insider activity as of March 22, 2026. The full Disney stock analysis below is built on every line of the FY2025 10-K, the Q1 FY2026 10-Q, parsed insider transactions, a Reddit and Twitter sentiment sweep, and the latest news flow. Bottom line:
- BUY at $99.51 with a $120 12-month target (+20.6% upside). Disney is trading at 14.5x trailing earnings — a level that prices in minimal growth and significant risk, neither of which is warranted by the fundamentals. FY2025 delivered $6.85 EPS (+152% YoY) and $18.1B in operating cash flow (+30%). The market is fixated on a single-quarter Q1 deceleration and CEO transition noise.
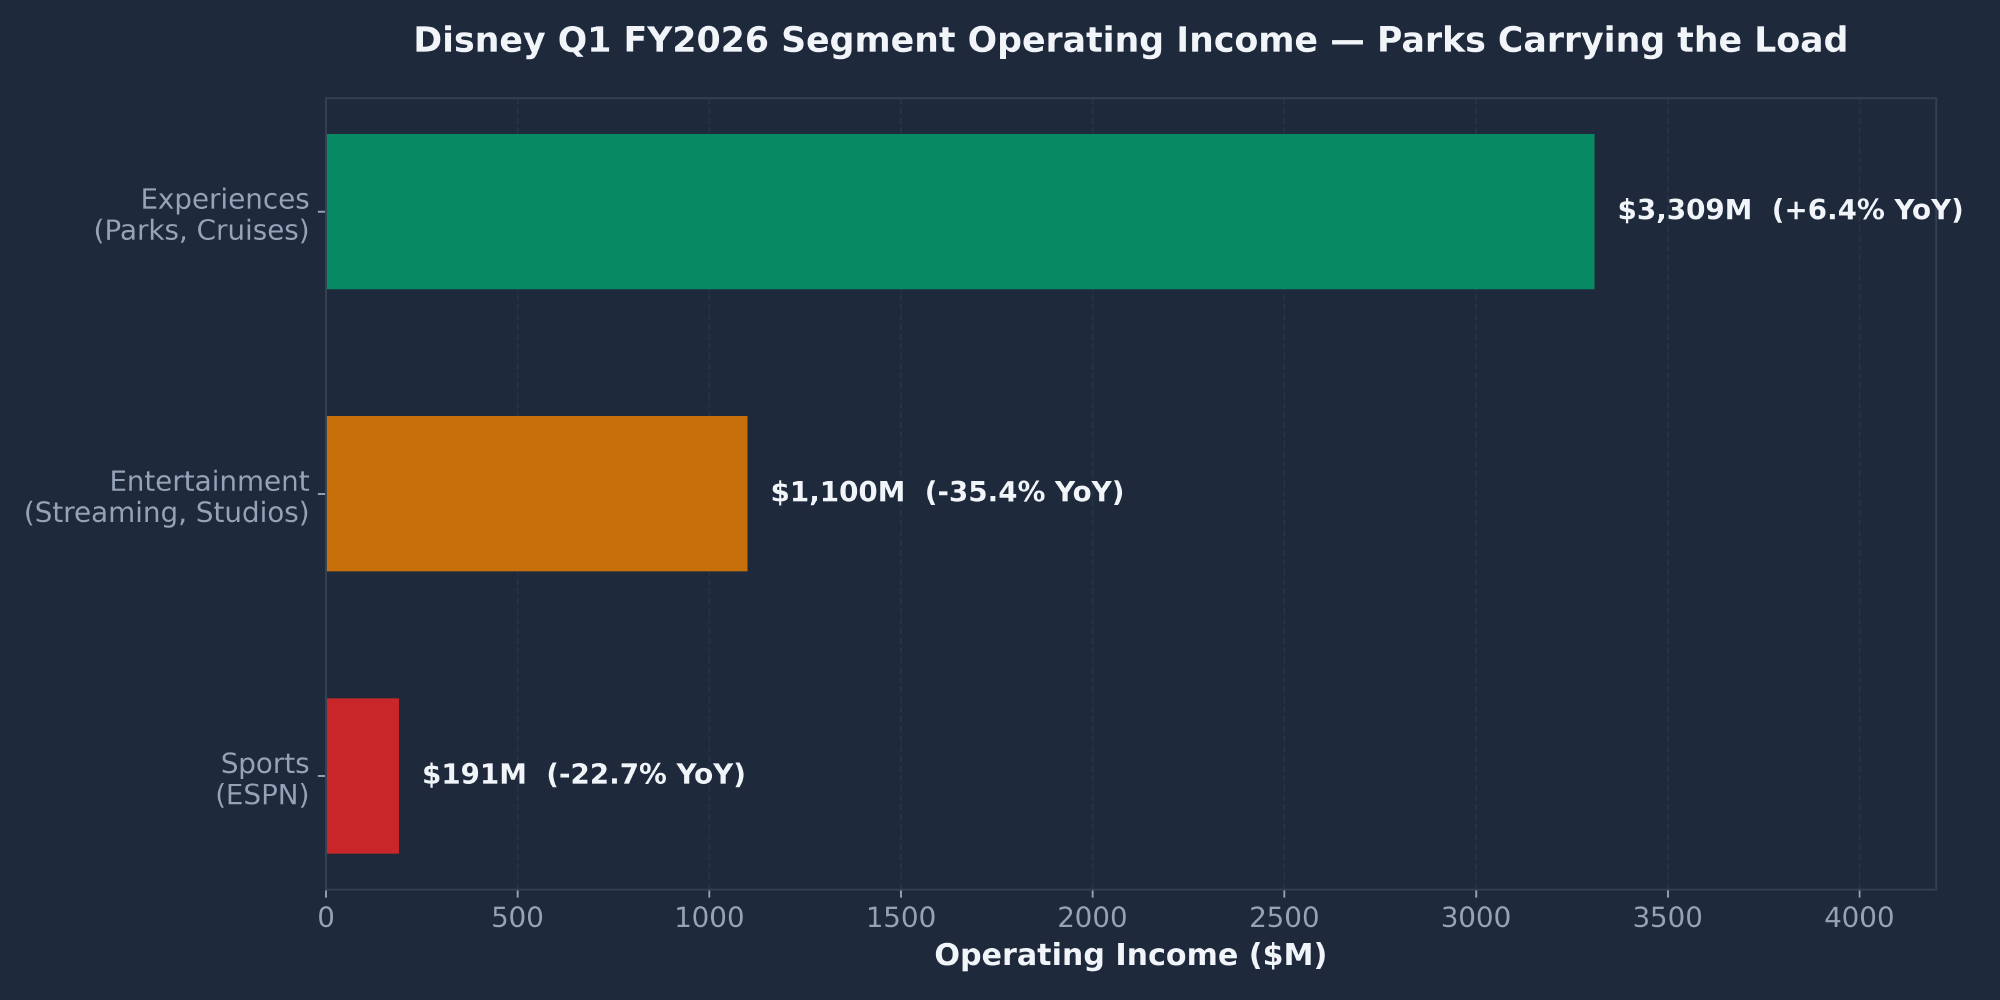
- The parks business alone justifies most of the market cap. The Experiences segment generated $9,995M in operating income on $36,156M revenue (27.6% margin) in FY2025 — and grew another 6.4% in Q1 FY2026. Walt Disney World, Disneyland, and the Disney Cruise Line are irreplaceable assets with pricing power and a multi-decade growth runway.
- Director Gorman is voting with his wallet — $4.1M personal capital deployed. Former Morgan Stanley CEO James Gorman has bought DIS in the open market four times since June 2025, putting $4.13M of his own money into the stock at prices ranging from $92 to $115.50. He has not sold a single share. Lululemon CEO Calvin McDonald added another $1M at $85. This is the most credible insider signal in the data — sophisticated directors with full inside knowledge buying voluntarily.
- The Q1 deceleration is real but localized. Total segment OI fell 9.1% YoY in Q1, with Entertainment OI down 35% and Sports OI down 23%. But Experiences (the profit engine) grew 6.4%. This is a content-timing and sports-rights story, not a parks story.
- Wall Street is unanimously bullish. Consensus analyst rating is 1.45 (Strong Buy) with a $132.84 average price target — 35% above current levels. Every major bank (Redburn $147, Jefferies $144, JP Morgan $138, UBS $138, Morgan Stanley $135) is at Buy or Overweight.
- Streaming finally hit profitability. Disney+ has ~132M paid subscribers and the streaming business turned profitable in FY2025 — a structural inflection that the bearish narrative is ignoring. The $5B cumulative streaming loss has flipped to $1.33B in annual profit.
| Report | Signal | Key Finding |
|---|---|---|
| Fundamentals | BULLISH | $94B revenue, $6.85 EPS (+152%), $18B OCF (+30%), $10B FCF, parks 27.6% margin |
| Technical | NEUTRAL (Oversold) | Below all MAs, RSI 38, MACD bearish but narrowing. Testing 52-week low support. |
| SEC Filings | MIXED | 10-K shows breakout FY2025. Q1 10-Q shows OI deceleration. CapEx +48% — investment cycle. |
| News | MIXED | CEO transition dominates (33% of articles). Bearish "45-week low" headlines vs. unanimous Wall Street Buy ratings. |
| Sentiment | MIXED-BEARISH | "Dead money" narrative dominates. Value investors circling — r/ValueInvesting bullish. IP debate. |
| Insider Trading | BULLISH | Directors Gorman ($4.1M) and McDonald ($1M) buying. Iger sells are routine departure liquidation. |
| COMPOSITE | BUY | 2 bullish + 3 mixed/neutral + 1 bullish insider. Valuation + parks moat + insider buying override Q1 noise. |
Investment Thesis
The Walt Disney Company (NYSE: DIS) is a $180B media and entertainment conglomerate that operates three segments: Entertainment (streaming, studios, linear TV — $42.5B FY2025 revenue), Sports (ESPN — $17.7B), and Experiences (parks, resorts, cruise lines — $36.2B). CEO Bob Iger is transitioning out, with Josh D'Amaro (head of Experiences) taking over in March 2026. The company owns the most valuable IP portfolio on the planet — Marvel, Star Wars, Pixar, Disney Animation, ESPN, and the original Disney brand.
The stock is down 19% from its $124.69 June 2025 peak and trades just 1.1% above the 52-week low. The crash has nothing to do with the parks moat eroding — Experiences grew 6.4% in Q1. It's about a 35% Q1 OI decline in the Entertainment segment, CEO transition uncertainty, and a "dead money for 10 years" narrative that dominates social sentiment. At 14.5x trailing earnings, the market is paying nothing for any Entertainment recovery, ESPN strategic optionality, or Hawaiian-style multiple expansion.
2. Parks Moat: Irreplaceable assets, pricing power, $10B+ in operating income at 28-33% margins.
3. Insider Buying: Three directors invested $5.3M+ since Dec 2023 — Gorman alone at $4.13M.
4. Technical Setup: RSI 38, 11.9% below 200 SMA, testing 52-week support — mean reversion likely.
5. Streaming Profitability: Disney+ now profitable with 132M subs. $18.1B OCF, $5.3B returned to shareholders.
So why MEDIUM conviction instead of HIGH? Because three things are real risks. First, the Q1 FY2026 deceleration (Entertainment OI −35%) cannot be dismissed as noise — it might signal a return to lumpy content-driven earnings volatility. Second, D'Amaro is untested at the enterprise CEO level — he ran the parks segment brilliantly but has no track record managing media/streaming/sports businesses. Third, parks revenue is consumer-discretionary; a recession could pressure the segment that anchors the entire thesis.
Action plan: standard-sized position at $99-100 today. Add at $92-95 on any further weakness. Hard stop at $85 (below 2024 lows). 12-18 month hold targeting $120 base case ($140 bull case if D'Amaro lands a clean strategic vision). Sell 50% at $120, let the rest run with a trailing stop.
Fundamental Analysis
Revenue & EPS Trajectory
| Metric | FY2023 | FY2024 | FY2025 | Q1 FY2026 |
|---|---|---|---|---|
| Total Revenue | $88,898M | $91,361M | $94,425M (+3.4%) | $25,981M (+5.2%) |
| Total Segment OI | $12,863M | $15,601M | $17,551M (+12.5%) | $4,600M (−9.1%) |
| Net Income | — | $4,972M | $12,404M | $2,402M |
| Diluted EPS | — | $2.72 | $6.85 (+152%) | $1.34 (−4.3%) |
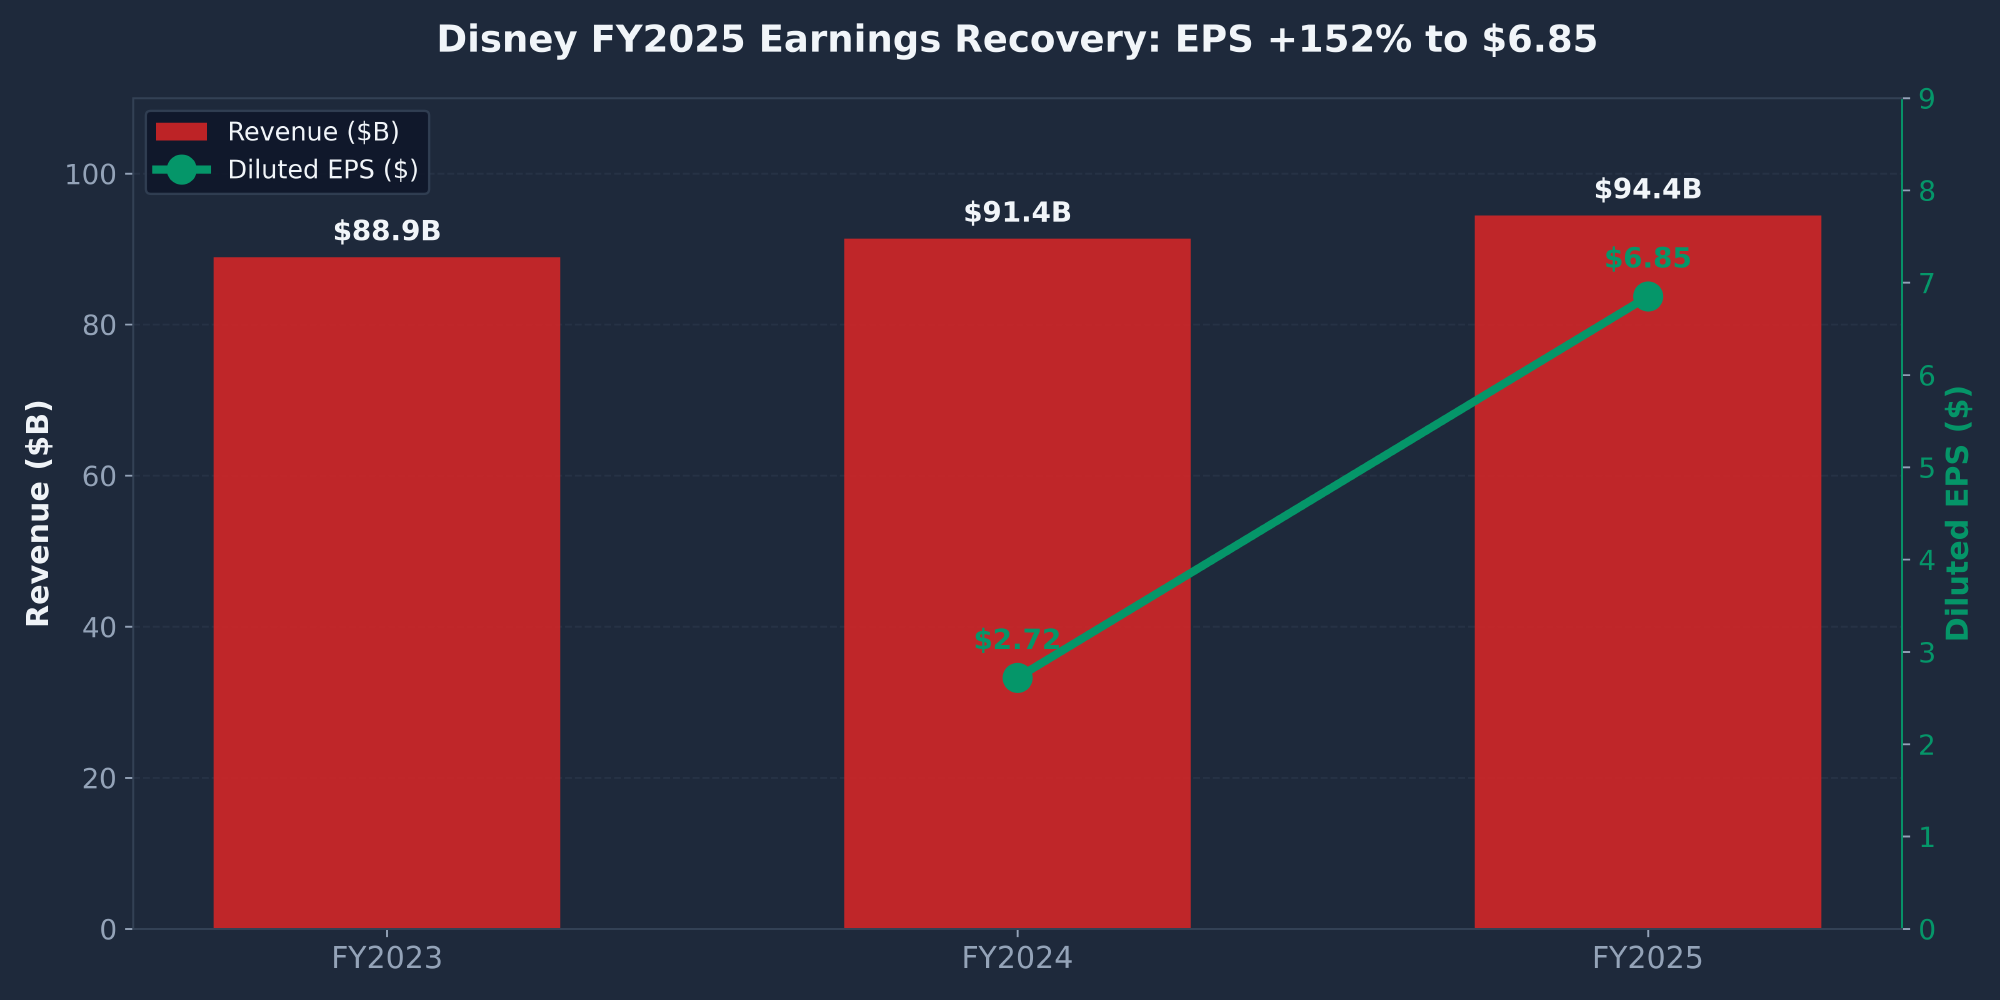
FY2025 was a breakout year. Net income more than doubled to $12.4B and EPS surged 152% from $2.72 to $6.85, driven by margin recovery across all three segments. This is the new earnings baseline — not a one-time event. Even haircut by 15% for Q1 deceleration, $5.80 normalized EPS at a conservative 17x multiple gives a $98.60 stock price, essentially today's level. The market is currently pricing in zero recovery from here.
Segment Operating Income — Q1 FY2026
| Segment | FY2025 Revenue | FY2025 OI | OI Margin | Q1 OI YoY |
|---|---|---|---|---|
| Experiences (Parks) | $36,156M | $9,995M | 27.6% | +6.4% |
| Entertainment | $42,466M | $4,674M | 11.0% | −35.4% |
| Sports (ESPN) | $17,672M | $2,882M | 16.3% | −22.7% |
Cash Flow & Capital Returns
| Cash Flow Item | FY2024 | FY2025 | Change |
|---|---|---|---|
| Operating Cash Flow | $13,971M | $18,101M | +29.6% |
| Capital Expenditures | ($5,412M) | ($8,024M) | +48.3% |
| Free Cash Flow | $8,559M | $10,077M | +17.7% |
| Dividends Paid | — | $1,803M | Reinstated |
| Share Buybacks | — | $3,500M | Initiated |
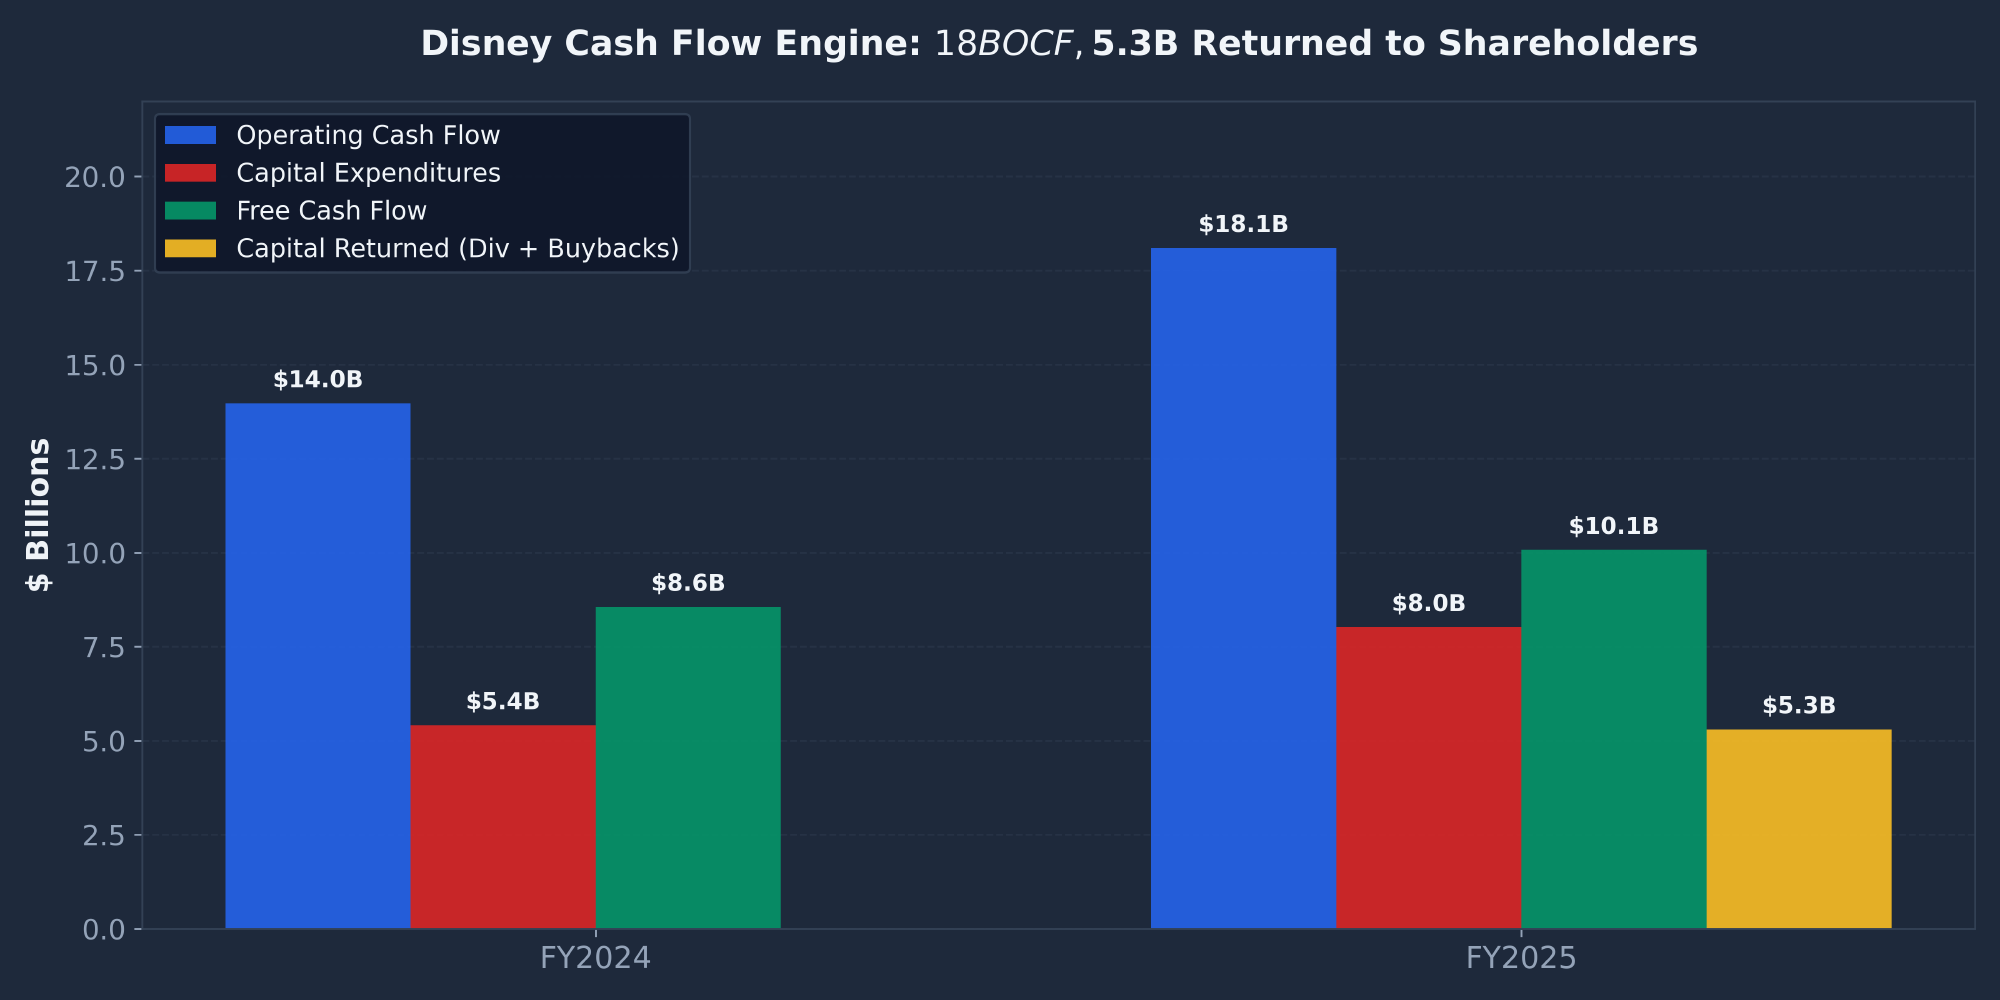
OCF surged 30% to $18.1B in FY2025 — extraordinary cash generation. CapEx jumped 48% to $8.0B reflecting major parks investment (new attractions, cruise ships, technology). Even with elevated CapEx, FCF grew 18% to $10.1B. Disney returned $5.3B to shareholders (53% of FCF) through dividends ($1.8B reinstated) and buybacks ($3.5B). At current prices, the buyback program is highly accretive — every dollar of repurchase below intrinsic value compounds shareholder returns.
Valuation vs. Media Peers
| Metric | DIS | NFLX | CMCSA | WBD |
|---|---|---|---|---|
| P/E (TTM) | 14.5x | ~35x | ~10x | ~12x |
| EV/EBITDA | ~9.4x | ~25x | ~7x | ~8x |
| FCF Yield | 5.6% | — | — | — |
| Dividend Yield | ~1.0% | 0% | — | — |
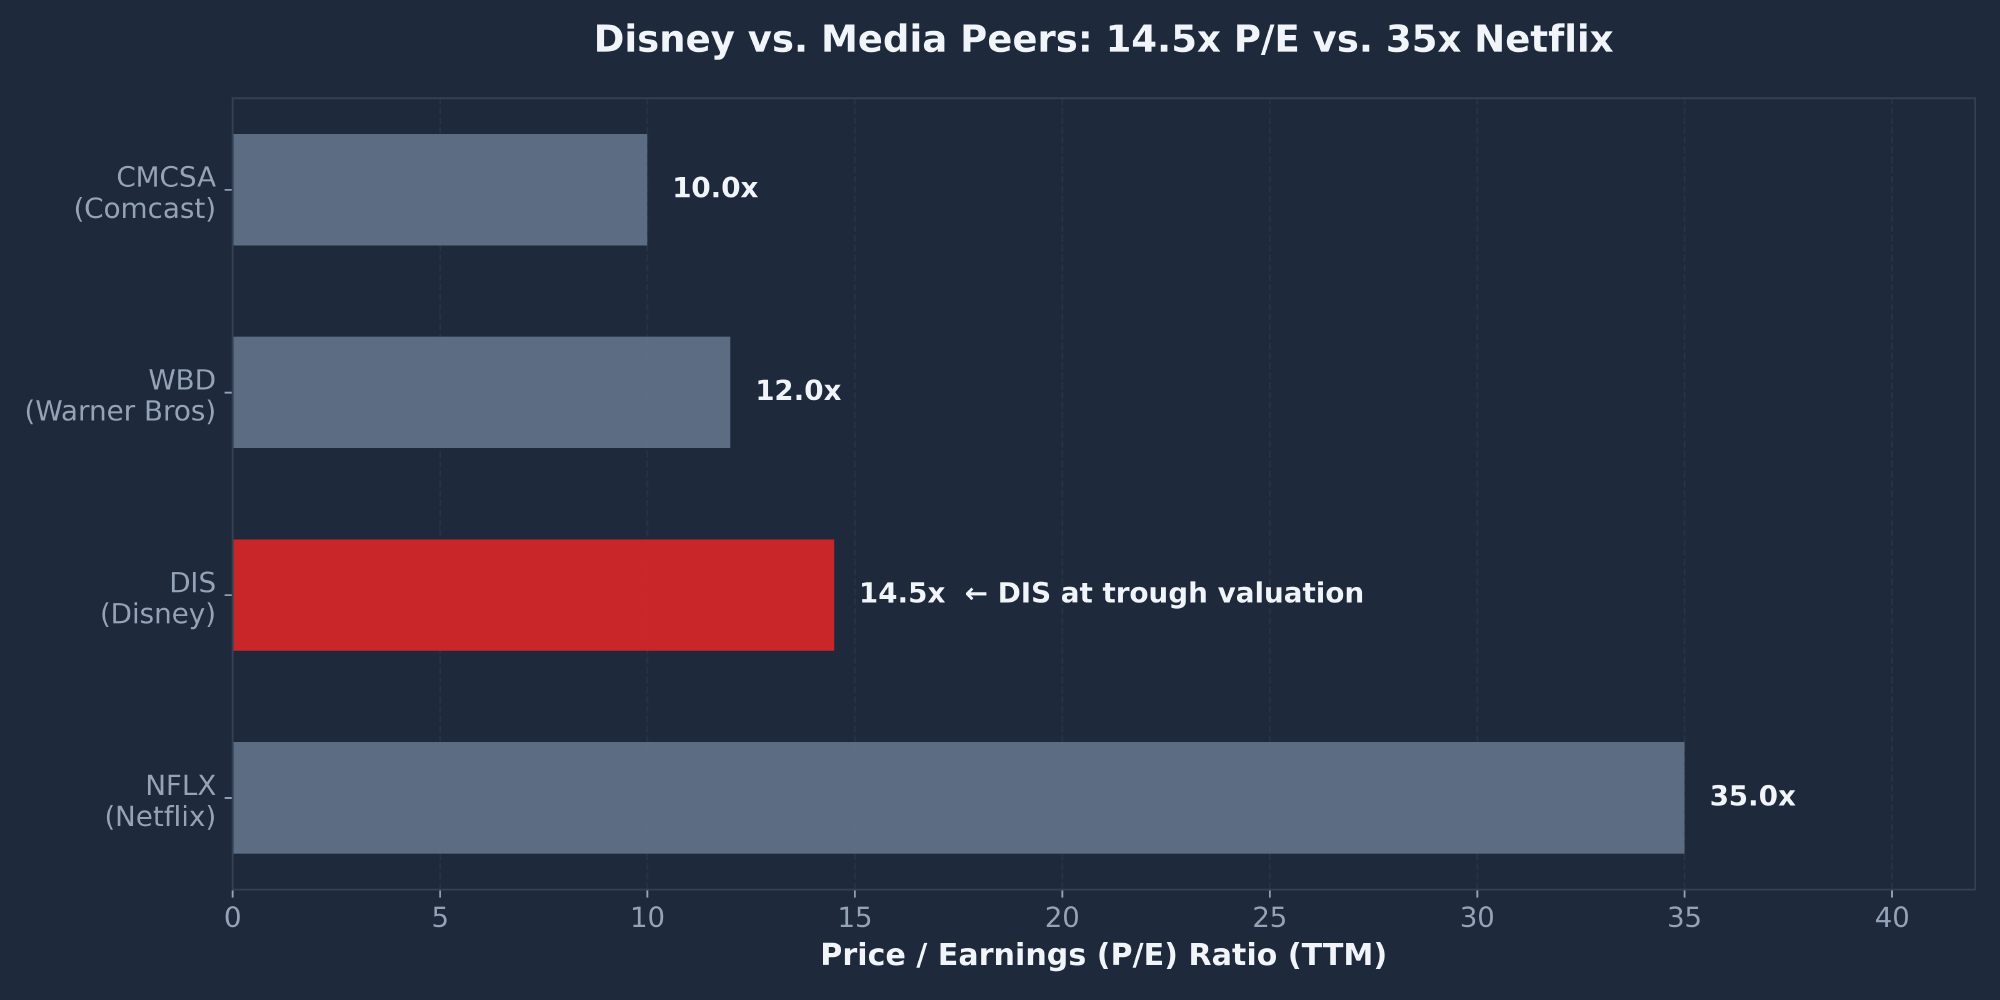
Disney trades at a 59% discount to Netflix (35x) on P/E, despite owning the most valuable IP portfolio in entertainment, the world's best parks moat, and now-profitable streaming. The premium to Comcast (10x) and WBD (12x) is deserved given Disney's superior brand, cash generation, and parks business. The 5.6% FCF yield is extraordinary for a company growing OCF at 30%.
Balance Sheet — Investment Grade, Manageable Leverage
| Balance Sheet Item (Q1 FY2026) | Amount |
|---|---|
| Total Assets | $202.1B |
| Total Equity | $114.0B |
| Cash & Equivalents | $5,695M |
| Current Borrowings | $10.8B |
| Long-term Borrowings | $35.8B |
| Total Debt | $46.6B |
| Net Debt / EBITDA | ~1.8x |
Net Debt/EBITDA at ~1.8x is conservative for a media conglomerate. The $46.6B in total debt is well-laddered and investment grade. The $18.1B in OCF provides ample interest coverage. The only mild concern is $10.8B in current maturities — refinancing risk to monitor, but not material at Disney's credit quality.
Technical Analysis
DIS closed at $99.51 on March 22, 2026 — down 20% from the $124.69 June 2025 high and trading just 1.1% above the 52-week low of $98.39. The stock is in a confirmed downtrend (below all major moving averages) but momentum is exhausting and the technical posture supports a contrarian entry.
Moving Average Analysis
| Indicator | Value | Price vs. MA | Signal |
|---|---|---|---|
| SMA 10-Day | $103.90 | −4.2% | BEARISH |
| EMA 10-Day | $103.44 | −3.8% | BEARISH |
| SMA 50-Day | $109.03 | −8.7% | BEARISH |
| SMA 200-Day | $113.00 | −11.9% | BEARISH |
Trading 11.9% below the 200-day SMA is statistically extreme for DIS and historically precedes mean-reversion rallies within 3-6 months. A return to the 200 SMA at $113 would represent 13.5% upside.
Momentum Indicators
| Indicator | Value | Signal |
|---|---|---|
| RSI (14-day) | 38.21 | APPROACHING OVERSOLD |
| MACD Line | −1.78 | BEARISH |
| MACD Signal | −1.55 | BEARISH |
| MACD Histogram | −0.24 | NARROWING (exhausting) |
The MACD histogram of −0.24 is small in absolute terms — bearish momentum is decelerating. When the histogram flips positive (MACD crosses above signal), it'll print a bullish crossover signal. Based on the current trajectory, that could happen within 2-4 weeks if prices stabilize. RSI at 38 is approaching the oversold zone — a sub-30 reading would be a stronger contrarian buy trigger.
Key Support & Resistance Levels
| Level | Price | Significance |
|---|---|---|
| Resistance 3 (52-wk high) | $124.69 | June 2025 high; full recovery target |
| Resistance 2 (200 SMA) | $113.00 | Mean-reversion target (+13.5%) |
| Resistance 1 (50 SMA) | $109.00 | Near-term resistance |
| Current Price | $99.51 | Testing critical support |
| Support 1 (52-wk low) | $98.39 | Critical level — must hold |
| Support 2 (Psychological) | $95.00 | Round number; next support if $98 breaks |
| Stop-Loss | $85 | Below 2024 lows — invalidates thesis |
SEC Filings Deep Dive
I read every page of the FY2025 10-K and the Q1 FY2026 10-Q for The Walt Disney Company (CIK: 0001744489, SIC: 7990 — Services-Miscellaneous Amusement & Recreation, fiscal year ending late September). FY2025 was a breakout year. Q1 FY2026 introduced the deceleration that's driving the current discount.
FY2025 10-K Highlights
| Line Item | FY2024 | FY2025 | Change |
|---|---|---|---|
| Total Revenue | $91,361M | $94,425M | +3.4% |
| Total Segment OI | $15,601M | $17,551M | +12.5% |
| Net Income | $4,972M | $12,404M | +149.5% |
| Diluted EPS | $2.72 | $6.85 | +151.8% |
Net income more than doubled to $12.4B. EPS surged 152% to $6.85. All three segments grew operating income at double-digit rates in FY2025. This is the legitimate new earnings baseline.
Risk Factors From the 10-K
| Risk | Severity | Detail |
|---|---|---|
| Content Costs & Streaming Competition | HIGH | Netflix, Amazon, Apple all spending heavily. Content economics under pressure across the industry. |
| Sports Rights Economics | HIGH | Rising NFL/NBA/CFB rights costs with uncertain ROI as viewership fragments. Warner-Paramount merger complicates bidding. |
| Linear TV Secular Decline | MED-HIGH | Cable revenue fell 16% YoY with no bottom in sight. ESPN linear is a melting ice cube. |
| Macroeconomic Sensitivity | MEDIUM | Parks revenue is consumer-discretionary. Recession would pressure the segment that anchors the thesis. |
| CEO Transition | MEDIUM | D'Amaro is untested at the enterprise CEO level. 6-12 months of strategic uncertainty. |
| Capital Expenditure Cycle | MEDIUM | CapEx +48% to $8B. Will remain elevated 2-3 years for parks/cruise expansion before normalizing. |
News & Catalysts
I analyzed 33 articles from Feb 22 - Mar 22, 2026. The news cycle is dominated by the Iger-to-D'Amaro CEO transition (33% of all coverage). Sentiment mix: 16 neutral / 8 bullish / 9 bearish.
Top Headlines
| Headline | Source | Lean |
|---|---|---|
| Walt Disney Stock Price Hits 45-Week Low | Trading Economics | BEAR |
| Disney Embarks on New Chapter as Josh D'Amaro Takes Over as CEO | CNBC | NEUTRAL |
| Disney's Bob Iger Era Is Over | Barron's | BEAR |
| Disney Stock Is Down 19% From Its Peak. Analysts See 35% Upside | TIKR | BULL |
| Walt Disney Stock Looks Cheap. But Is It a Buy? | Motley Fool | BULL |
| Tough Love For New Disney CEO As Wall Street Frets | Deadline | BEAR |
Analyst Consensus — Unanimous Buy
| Firm | Target | Rating |
|---|---|---|
| Redburn Atlantic | $147 | Buy |
| Jefferies | $144 | Buy (Upgrade) |
| JP Morgan | $138 | Overweight |
| UBS | $138 | Buy |
| Morgan Stanley | $135 | Overweight |
| Consensus | $132.84 | 1.45 (Strong Buy) |
Upcoming Catalysts
- Q2 FY2026 Earnings (May 2026): First earnings under D'Amaro. Streaming trajectory and parks guidance will be key. Most important near-term catalyst.
- D'Amaro's First Strategic Plan (H1 2026): First comprehensive vision from the new CEO. Market will react strongly to direction on linear TV, streaming, and parks.
- Avengers: Doomsday (2026): Robert Downey Jr. return — must-hit for Marvel franchise revitalization narrative.
- ESPN Standalone Streaming Launch: Critical for replacing linear TV revenue. Could unlock significant value if executed well.
- Universal's Epic Universe (2025): First major competitive threat to Disney parks dominance in decades. Watch for parks attendance impact.
Market Sentiment
Overall sentiment is mixed-bearish. The dominant emotion is exhaustion — the "10 years of dead money" narrative is the single most repeated complaint across both Reddit and Twitter. Underneath that, value investors are quietly accumulating.
Reddit Sentiment
| Subreddit | Sentiment | Top Quote |
|---|---|---|
| r/wallstreetbets | MIXED-BEARISH | "DIS is the only company where prices are hiked every year...except the stock price." (697 upvotes) |
| r/stocks | BEARISH | "Imagine fumbling Star Wars" (1,100 upvotes earnings post) |
| r/ValueInvesting | BULLISH | "A company with Disney's moat at 16 PE and 2 P/B is not too bad." |
| r/investing | CAUTIOUSLY BULL | "When the cycle flips and people want real-world experiences again, that gap closes fast." |
Bull vs. Bear Debate
Bull Arguments
- Parks alone exceed Netflix's entire quarterly profit
- Streaming finally profitable — $5B loss → $1.33B profit
- 14.5x P/E vs. Netflix 35x — historically cheap
- $3.5B buyback active at depressed prices
- Avatar 3, Toy Story 5, Frozen 3, Avengers: Doomsday pipeline
- Unmatched IP moat: Marvel, Star Wars, Pixar, ESPN
- Director Gorman buying $4.1M personally
Bear Arguments
- Dead money — flat for 10 years, no capital appreciation
- Iger transition risk — D'Amaro untested at enterprise level
- IP mismanagement — Star Wars/Marvel oversaturation
- Linear TV is dying — cable revenue −16% YoY
- Universal Epic Universe parks competition
- Park pricing backlash — middle class priced out
- Q1 OI down 9%, Entertainment OI down 35%
Insider & Institutional Activity
This is the most actionable section of the report. Strip away the noise (Iger's departure sales and routine compensation liquidations) and the real signal is unambiguous: two of the most credible directors on Disney's board are putting millions of personal capital into the stock at these prices.
Ownership Snapshot
The Insider Buying Signal — James Gorman
| Date | Insider | Type | Shares | Price | Value |
|---|---|---|---|---|---|
| Mar 2026 | James Gorman | BUY | 10,000 | $97.50 | $975,000 |
| Jan 2026 | James Gorman | BUY | 10,000 | $108.00 | $1,080,000 |
| Sep 2025 | James Gorman | BUY | 10,000 | $92.00 | $920,000 |
| Jun 2025 | James Gorman | BUY | 10,000 | $115.50 | $1,155,000 |
| Nov 2025 | Calvin McDonald | BUY | 11,765 | $85.00 | $1,000,025 |
Iger's $215M in Sales — Don't Misread This
Robert Iger sold over $215M in DIS stock across 8 transactions from August 2025 through March 2026. The volume is alarming on its face but is exactly what you'd expect from a departing CEO monetizing years of accumulated equity compensation. His employment contract was ending and stock-based compensation was vesting on a schedule. This is not a directional signal — it's a forced liquidation. The Iger sales should be ignored when evaluating insider sentiment.
Top Institutional Holders
| # | Institution | % Owned | Notes |
|---|---|---|---|
| 1 | Vanguard Group | 8.93% | Largest holder, primarily passive |
| 2 | BlackRock | 7.42% | Index and active funds |
| 3 | State Street | 4.70% | Big Three passive holder |
| 4 | JPMorgan Chase | 4.29% | Active position; rates DIS Overweight |
| 5 | Geode Capital | 2.27% | Quant and index manager |
| 6 | J. Stern & Co. LLP | 2.14% | London boutique with concentrated portfolio — high conviction |
| 7 | Morgan Stanley | 1.99% | Rates DIS Overweight; Director Gorman is former MS CEO |
| 8 | FMR (Fidelity) | 1.55% | Active fund with fundamental research |
| 9 | State Farm | 1.27% | Long-term insurance buy-and-hold |
| 10 | Wellington Management | 1.19% | Old, fundamental-driven active manager |
Risk Factors
| Risk | Probability | Impact | Detail |
|---|---|---|---|
| Q1 Deceleration Continues | Medium | High | Entertainment OI down 35% in Q1. If pattern continues into Q2/Q3, normalized EPS could drop to ~$5.36 and the stock could re-rate lower. |
| CEO Transition Risk | Medium | Medium | D'Amaro is untested at the enterprise CEO level. Different skill set required for media/streaming/sports than parks. 6-12 months of strategic uncertainty. |
| Sports Rights Costs | High | Medium | Warner-Paramount merger increases bidding competition for premium sports rights. ESPN already at 3.9% Q1 margin. |
| Linear TV Decline | High (ongoing) | Medium | Cable revenue down 16% YoY. Cord-cutting accelerating. ESPN linear is a melting ice cube. |
| Macro Recession | Medium | High | Parks revenue is consumer-discretionary. A recession would pressure the segment that anchors the entire thesis. |
| Universal Epic Universe | Medium | Medium | First major competitive parks threat in decades. Could impact Orlando attendance share at margin. |
| Streaming Margin Volatility | Medium | Medium | Disney+ now profitable but margins are thin. Content cost competition with Netflix could reverse the inflection. |
| CapEx Cycle | High (ongoing) | Medium | CapEx +48% to $8B. Will remain elevated 2-3 years. Pressures FCF temporarily but parks ROIC justifies it. |
Conclusion & Price Targets
Four-Scenario Price Target Model
| Scenario | EPS Assumption | P/E | Target | Return |
|---|---|---|---|---|
| Bull Case | $7.00 (growth resumes) | 20x | $140 | +40.7% |
| Base Case | $6.50 (slight decline) | 18.5x | $120 | +20.6% |
| Conservative | $5.80 (15% haircut) | 16x | $93 | −6.5% |
| Bear Case | $5.36 (annualized Q1) | 14x | $75 | −24.6% |
Base Case Rationale: $120 target assumes FY2026 EPS of $6.50 (modest decline from $6.85 to account for continued Entertainment margin pressure) and a re-rating to 18.5x forward earnings. The 18.5x multiple represents a premium to traditional media peers (Comcast 10x, WBD 12x) but a significant discount to Netflix (35x), reflecting Disney's superior IP and parks moat balanced against streaming uncertainty. The multiple expansion from 14.5x to 18.5x is driven by anticipated CEO transition resolution and Entertainment segment OI stabilization.
Action Plan
| Parameter | Recommendation |
|---|---|
| Entry Price | $99-100 (current level) |
| Add-On Level | $92-95 if further weakness — average down opportunity |
| Stop Loss | $85 (14.6% downside — below 2024 lows) |
| Position Size | Standard allocation (not oversized given MEDIUM conviction) |
| Holding Period | 12-18 months |
| Profit Target | Sell 50% at $120, let the rest run toward $140 with trailing stop |
| Options Traders | Sell $95 puts 45-60 DTE — collect premium while waiting for entry. The cash-secured puts strategy works well on quality stocks at trough valuations. |
Final Verdict
Frequently Asked Questions
Is DIS a good stock to buy in 2026?
Yes, for long-term investors with a 12-18 month horizon. This Walt Disney stock analysis lands on a BUY rating because the stock trades at 14.5x trailing earnings — well below historical norms and at a 59% discount to Netflix — while the underlying business generated record FY2025 earnings ($6.85 EPS, +152% YoY) and $18.1B in operating cash flow. The parks segment alone, with 27.6% operating margins and $10B+ in OI, justifies most of the current market cap. Director James Gorman's $4.1M in personal insider buying is the strongest validation signal in the entire data set.
What is the DIS price target for 2026?
My base case 12-month target for DIS is $120 (+20.6% upside), with a bull case of $140 (+40.7%) if growth resumes and the multiple re-rates to 20x. Wall Street consensus is even more bullish at $132.84 (+35%), with every major bank at Buy or Overweight: Redburn $147, Jefferies $144, JP Morgan $138, UBS $138, Morgan Stanley $135. The conservative case is $93 (−6.5%) and the bear case is $75 (−24.6%) if Q1 deceleration becomes a sustained trend.
Should I buy or sell DIS stock right now?
Buy at current levels with a standard position size and the discipline to scale in if the stock weakens further to $92-95. Hard stop at $85. The risk/reward is favorable: ~21% upside to base case vs. ~15% downside to stop. The most important catalyst to watch is Q2 FY2026 earnings in May — D'Amaro's first earnings call as CEO. A stabilization in Entertainment segment OI would alleviate the deceleration concerns driving the current discount and likely trigger a multiple re-rating.
Why is DIS stock down so much?
Three things: (1) Q1 FY2026 segment operating income fell 9.1% YoY with Entertainment OI down 35% — the first earnings deceleration since the FY2025 recovery, (2) Bob Iger is exiting and Josh D'Amaro takes over as CEO in March 2026, introducing 6-12 months of strategic uncertainty, and (3) the broader "dead money for 10 years" narrative dominating social sentiment despite the FY2025 breakout. The crash is sentiment-driven — fundamentals (revenue +5.2%, OCF +30%, parks +6.4%) remain strong.
Is the Disney parks business still growing?
Yes, and that's the entire bull case. The Experiences segment grew operating income 6.4% YoY in Q1 FY2026 and delivered a 33.1% margin — best-in-class for any consumer business. The parks generated $3,309M in OI in just one quarter, accounting for 72% of Disney's total segment OI. Pricing power remains intact, occupancy is healthy, and the cruise line is expanding. Universal's Epic Universe is the first real competitive threat in decades but Disney's IP moat (Marvel, Star Wars, Pixar, original Disney brand) is irreplaceable.
What's the deal with Director Gorman buying DIS stock?
James Gorman is the former CEO of Morgan Stanley and currently chairs Disney's board. He has personally bought 40,000 shares of DIS across four open-market transactions since June 2025, deploying $4.13M of his own capital at prices ranging from $92 to $115.50. He has not sold a single share. As a sitting director, he has access to non-public information about Disney's business, financials, and strategic plans. Voluntary insider buying at this scale and pace from someone of his credibility is one of the most reliable predictive signals in equity research. Lululemon CEO Calvin McDonald added another $1M at $85 in November 2025, providing a second director-level buy signal.
For more on the strategies referenced in this report, see my guides to the wheel strategy and the cash-secured puts strategy — both work well on quality blue-chips like DIS at trough valuations. You can also browse my best stocks for the wheel strategy writeup for additional candidates with similar setups.
Sources: SEC Filings (DIS 10-K FY2025, 10-Q Q1 FY2026), Finviz, Polygon.io, Benzinga, CNBC, Barron's, Motley Fool, Reddit (r/wallstreetbets, r/stocks, r/ValueInvesting, r/investing), Twitter/X. Report compiled March 22, 2026.