RCL Stock Analysis: Royal Caribbean Hold | $315 Target
Table of Contents
Executive Summary
This RCL stock analysis covers Royal Caribbean Group, the world’s second-largest cruise operator by berths. It runs about 24% of global cruise capacity — 69 to 71 ships and roughly 180,000 berths — across Royal Caribbean International, Celebrity Cruises and Silversea, plus a 50% stake in TUI Cruises. At $282.26 (October 9 close) the stock carries a $75.5 billion market cap and a $98.4 billion enterprise value, 23% below its $366.50 all-time high.
My verdict is HOLD with a 12-month target of $315, about 11.6% upside (13.7% including the dividend). Conviction is MEDIUM. This Royal Caribbean stock analysis comes down to one line: great company, fair price. The six research strands behind it were re-read independently to check for confirmation bias, and that second review reached the same call (HOLD, $310).
- Great company, fair price. RCL is the best operator in cruising — 39% EBITDA margins, 18% ROIC, investment-grade debt, and 16 straight quarters above the top of its own guidance — trading at 15.9× 2026 and about 14× 2027 earnings.
- But the easy money is gone. Net yield growth has collapsed from +11.6% (2024) to about +2% (2026). Q3 yields are guided flat, Q2 EPS fell year over year for the first time since the recovery, and the full-year guide needs a ~31% jump in Q4 EPS.
- Capital allocation has flipped from deleveraging to re-levering: a debt-funded $3 billion Sandals Resorts stake, buybacks above free cash flow, a $16.5 billion order book and about $8 billion of 2028 cash calls — with ratings at the lowest investment-grade notch.
- The people with the best information are sellers. No insider has bought a share in 26 months (none at $222), and Capital Research — the holder that rode RCL up from the COVID lows — halved its stake in Q3.
- The +27% bounce from $222 already captured the rebound. The stock is pinned under its 200-day / Fibonacci wall at $286–289. My base case of ~$315 in 12 months is a market-like return for a stock with a 1.6–1.9 beta. Hold existing positions; buy pullbacks to $250–265, or upgrade on a strong October 27 print.
Investment Thesis
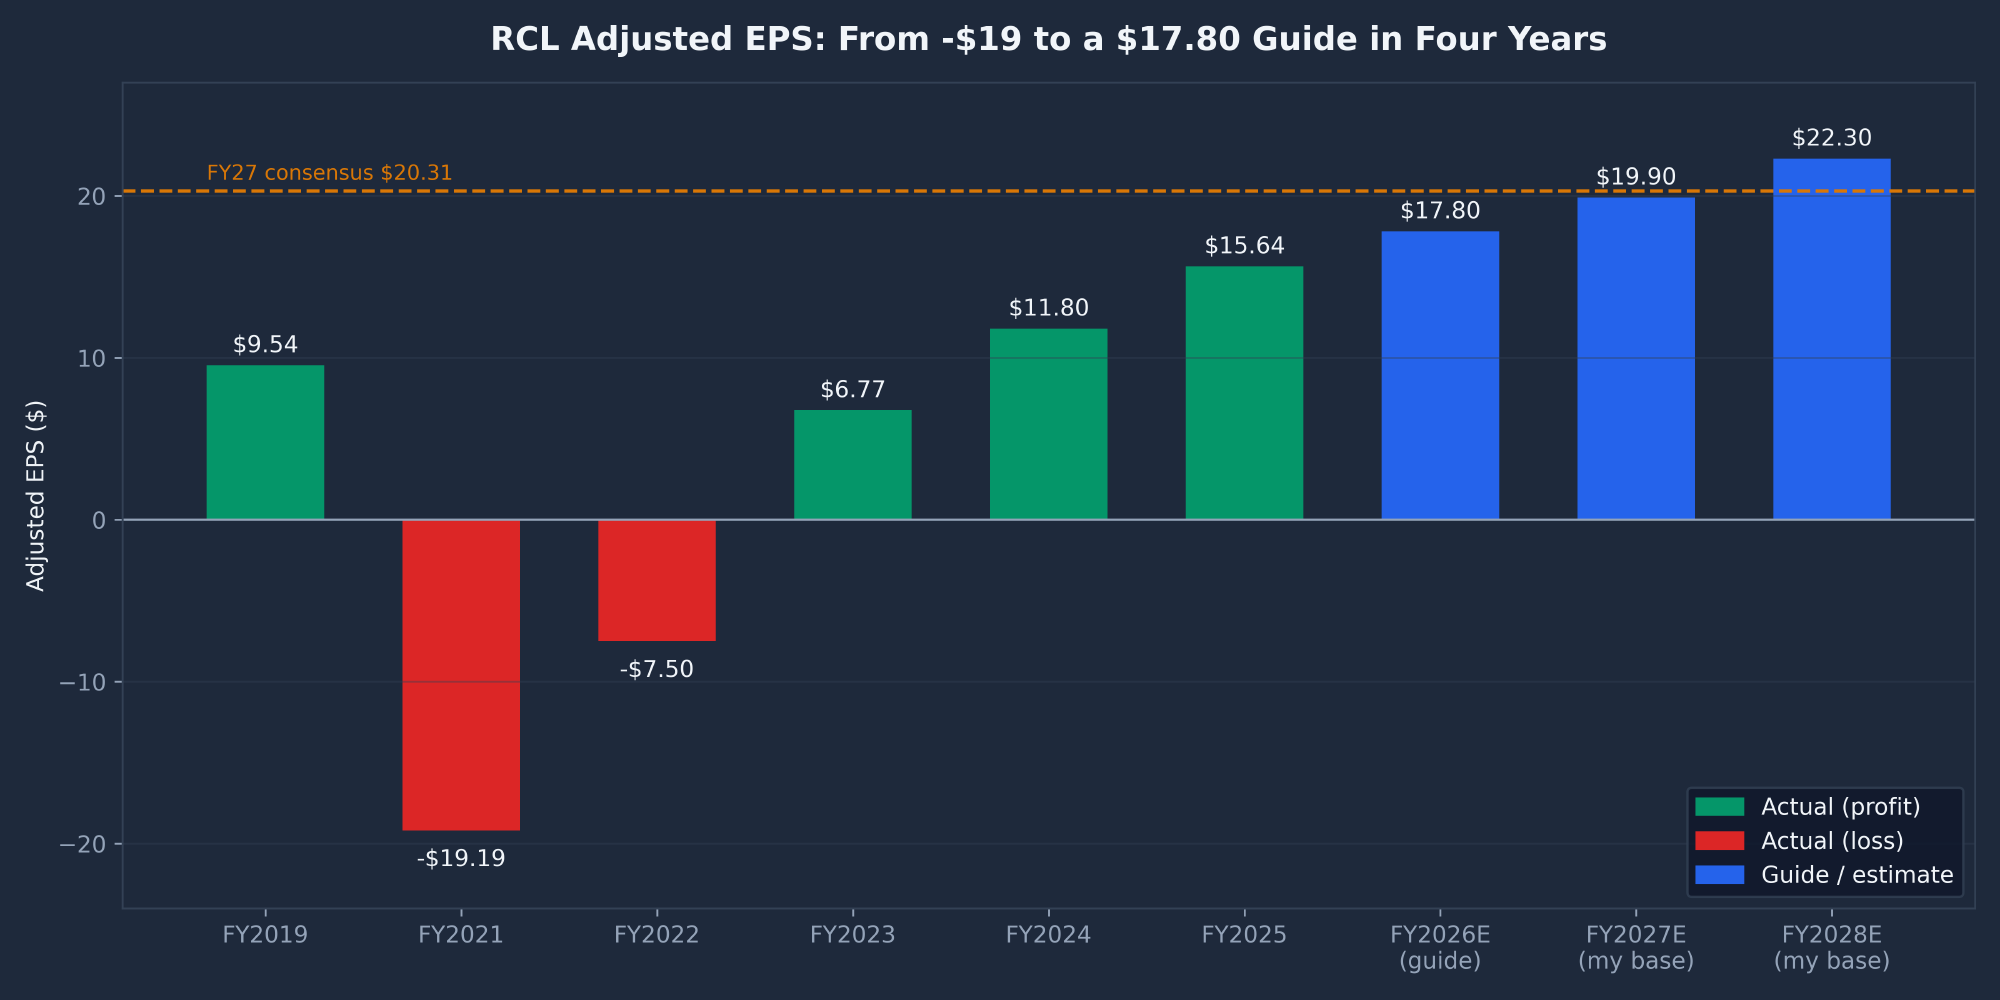
Royal Caribbean has done almost everything right since 2022. It hit every Trifecta target 18 months early, turned 11.6%-coupon ship-secured debt into 4.66% unsecured investment-grade paper, lifted EBITDA margins from 33% to 39%, and grew adjusted EPS from $6.77 (2023) to $15.64 (2025). Management’s guidance record is the best in the sector.
Nothing in my work suggests the franchise is broken. Icon-class ships, private destinations like Perfect Day at CocoCay and a 28-million-member loyalty base are real competitive advantages. RCL also grows capacity faster than an industry whose order book is disciplined at about 3% a year.
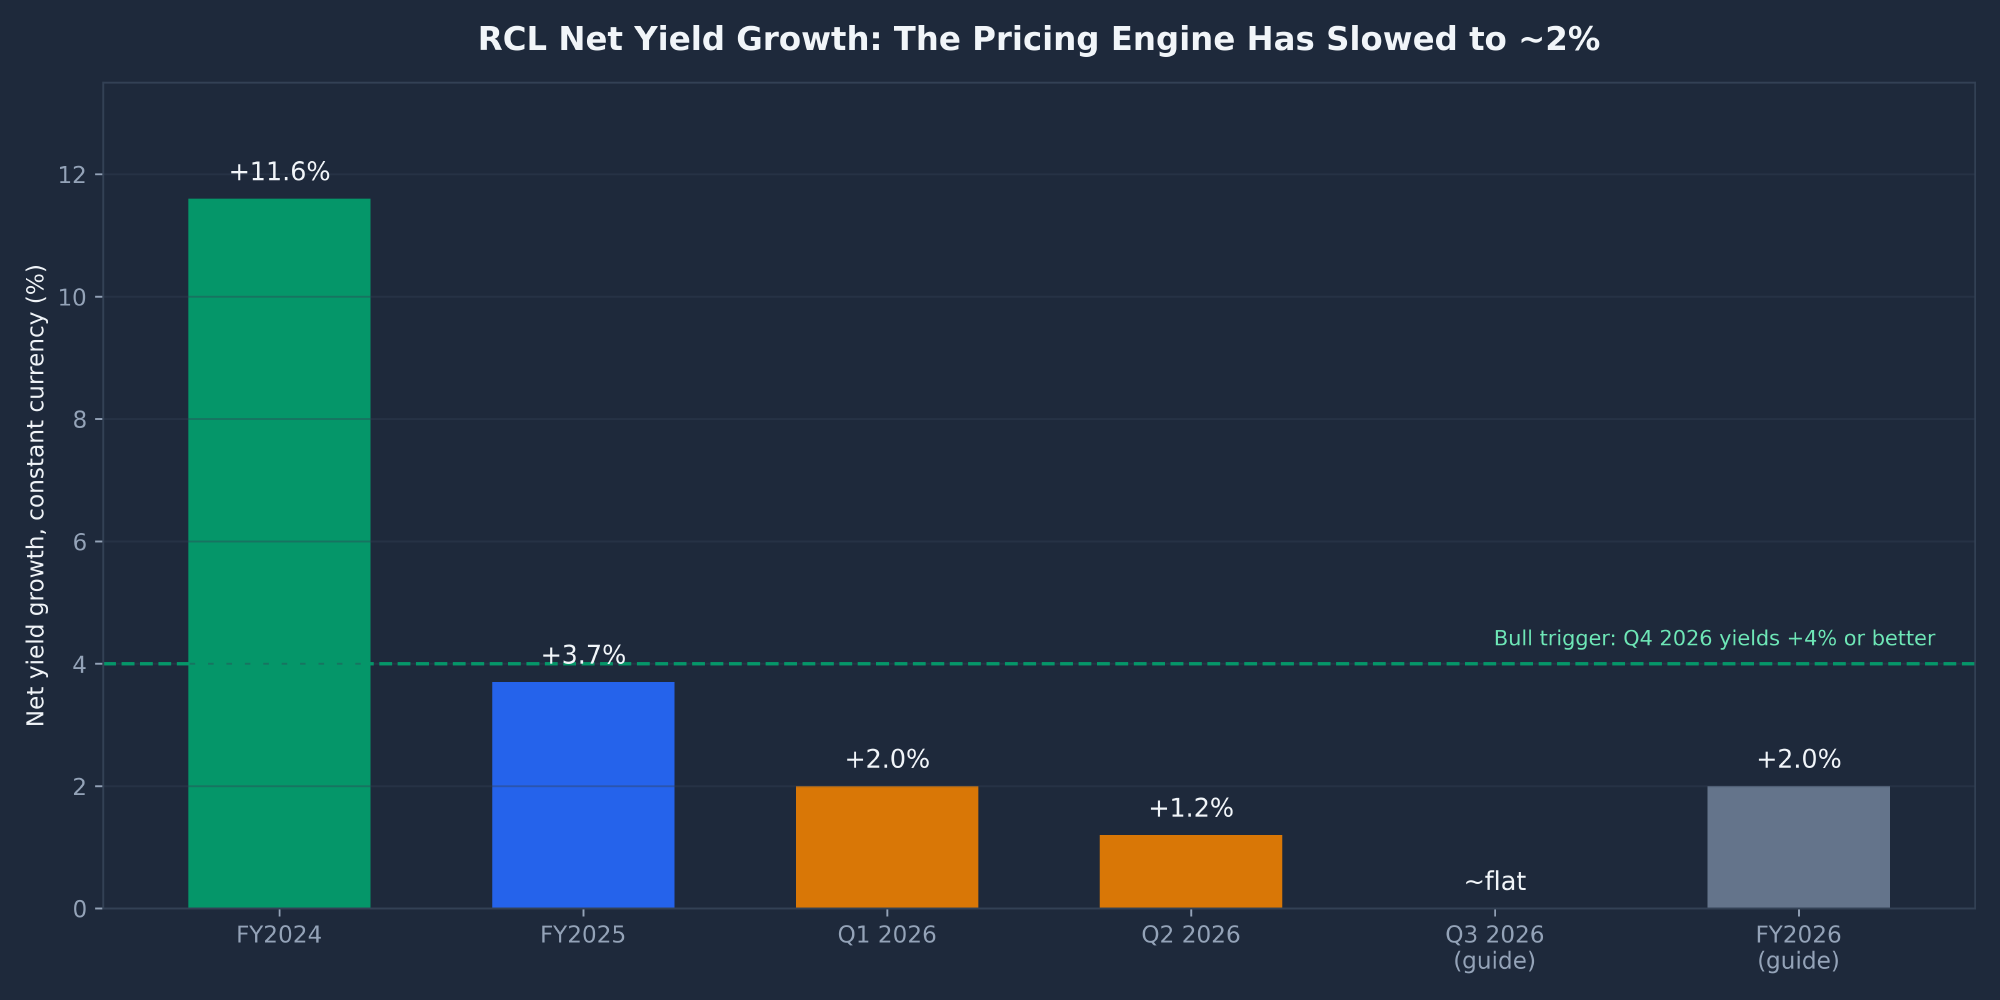
The problem is that 2026 marks a regime change the market has noticed but not fully priced in either direction. The growth engine has shifted from pricing (yields +11.6% → +3.7% → ~+2%) to capacity (+6.6% in 2026, +4% in 2027).
At the same time, management is spending on three fronts at once — ships ($2.5 billion in 2027, $4.6 billion in 2028), land (Sandals, destinations, river cruising) and shareholder returns ($3.1 billion trailing) — and the sum exceeds free cash flow. That works beautifully if yields re-accelerate, as BofA (≥4% in Q4) and Jefferies (+3.3% in 2027) expect. It works poorly if the consumer softens. The travel-trade and Reddit tells — 2×-points promotions, unprecedented casino mailers, repricing threads, stricter cancellation penalties — are early but consistent.
At $282, the market is paying about 14× the consensus 2027 EPS of $20.31. That number requires ~14% growth from a year with ~2% pricing. I think ~$19.90 is more realistic, which supports ~$315 at a 16× multiple — attractive versus history, but only ~12% upside against a bear case of ~$205 (−27%) if yields turn negative.
That skew (+$33 base vs. −$77 bear) does not justify initiating at today’s price. But the quality of the business and the beat history do not justify selling either.
Fundamental Analysis
All figures in this section come from Finviz Elite (snapshot, eight years of statements, 20 analyst actions, 13F data), SEC 10-K, 10-Q and 8-K filings from FY2021 through Q2 2026, and daily price data. Dollar figures are in millions unless noted.
| Price | Market Cap | Enterprise Value | 52-Week Range | Short Float | Next Earnings |
|---|---|---|---|---|---|
| $282.26 | $75.49B | $98.36B | $222.22 – $356.39 | 4.53% (4.7 days) | Oct 27, 2026 (before the open) |
Royal Caribbean Company Overview
| Item | Detail |
|---|---|
| Business | World’s #2 cruise operator by berths (~24% global share; 69–71 ships, ~180K berths). Brands: Royal Caribbean International (family/contemporary, 29+ ships including the Icon class), Celebrity (premium, 15 ships), Silversea (luxury/expedition, 12 ships); 50% of TUI Cruises / Hapag-Lloyd (German JV). Private destinations: Perfect Day at CocoCay, Royal Beach Clubs (Paradise Island opened December 2025, Santorini 2026), Labadee (closed), Perfect Day Mexico (permit at risk). Pending: 50% of Sandals/Beaches Resorts for ~$3B (close early 2027). |
| Sector / Industry | Consumer Cyclical / Travel Services · S&P 500 |
| HQ / Incorporation | Miami, FL · incorporated in Liberia (effective tax rate ~2%) |
| Employees | 108,000 (87% of shipboard crew unionized) |
| IPO | April 28, 1993 (NYSE). Founded 1968 by Arne Wilhelmsen; the Wilhelmsen family still owns 6.1%. |
| Leadership | Jason Liberty (Chairman & CEO; CEO since January 2022, Chairman since late 2025), Naftali Holtz (CFO), Michael Bayley (CEO, Royal Caribbean International), Laura Hodges Bethge (President, Celebrity). Richard Fain (CEO 1988–2021) remains a director. |
RCL Price History: The Last 2.5 Years
| Period | Price Range | Move | Driver |
|---|---|---|---|
| Apr 2024 – Jan 2025 | $125 → $277 | +122% | Trifecta goals hit 18 months early; dividend reinstated (July 2024); debt fully unsecured; investment-grade upgrades begin |
| Feb – Apr 2025 | $272 → $164 | −40% | Tariff / recession scare; February 2025 insider sale cluster at ~$262 |
| Apr – Aug 2025 | $164 → $366.50 (ATH) | +123% | Perfecta program (20% EPS CAGR), Q2 2025 beat-and-raise, S&P BBB− / Moody’s Baa3 |
| Sep – Nov 2025 | $363 → $245 | −33% | Q3 2025 (Oct 28): −8.5% as yield growth decelerated to ~2–3% guided |
| Dec 2025 – Feb 2026 | $245 → $356 | +45% | Q4 2025 (Jan 29): +18.7%, 2026 EPS guide $17.70–18.10, dividend +50% to $1.50/quarter |
| Mar – May 2026 | $356 → $232 | −35% | Iran war / Strait of Hormuz closure; crude >$90; FY26 guide cut to $17.10–17.50 (April) |
| Jun – Aug 4, 2026 | $266 → $334 | +26% | Q1/Q2 beats; guide raised to $17.73–17.87 (July) |
| Aug 4 – Sep 23, 2026 | $334 → $222 | −33% | Brent ~$108; Q2 EPS down year over year; $3B debt-funded Sandals stake (Sep 22–23) |
| Sep 24 – Oct 9, 2026 | $222 → $282 | +27% | BofA / Deutsche / Jefferies upgrades to Buy (~$330); Carnival record Q3 |
Performance: YTD +1.2% · 1 year −8.1% · 3 years +220% · 5 years +222%. The stock has gone nowhere for 14 months despite EPS growing about 20%. The multiple has compressed from ~23× trailing (August 2025) to 17.4×.
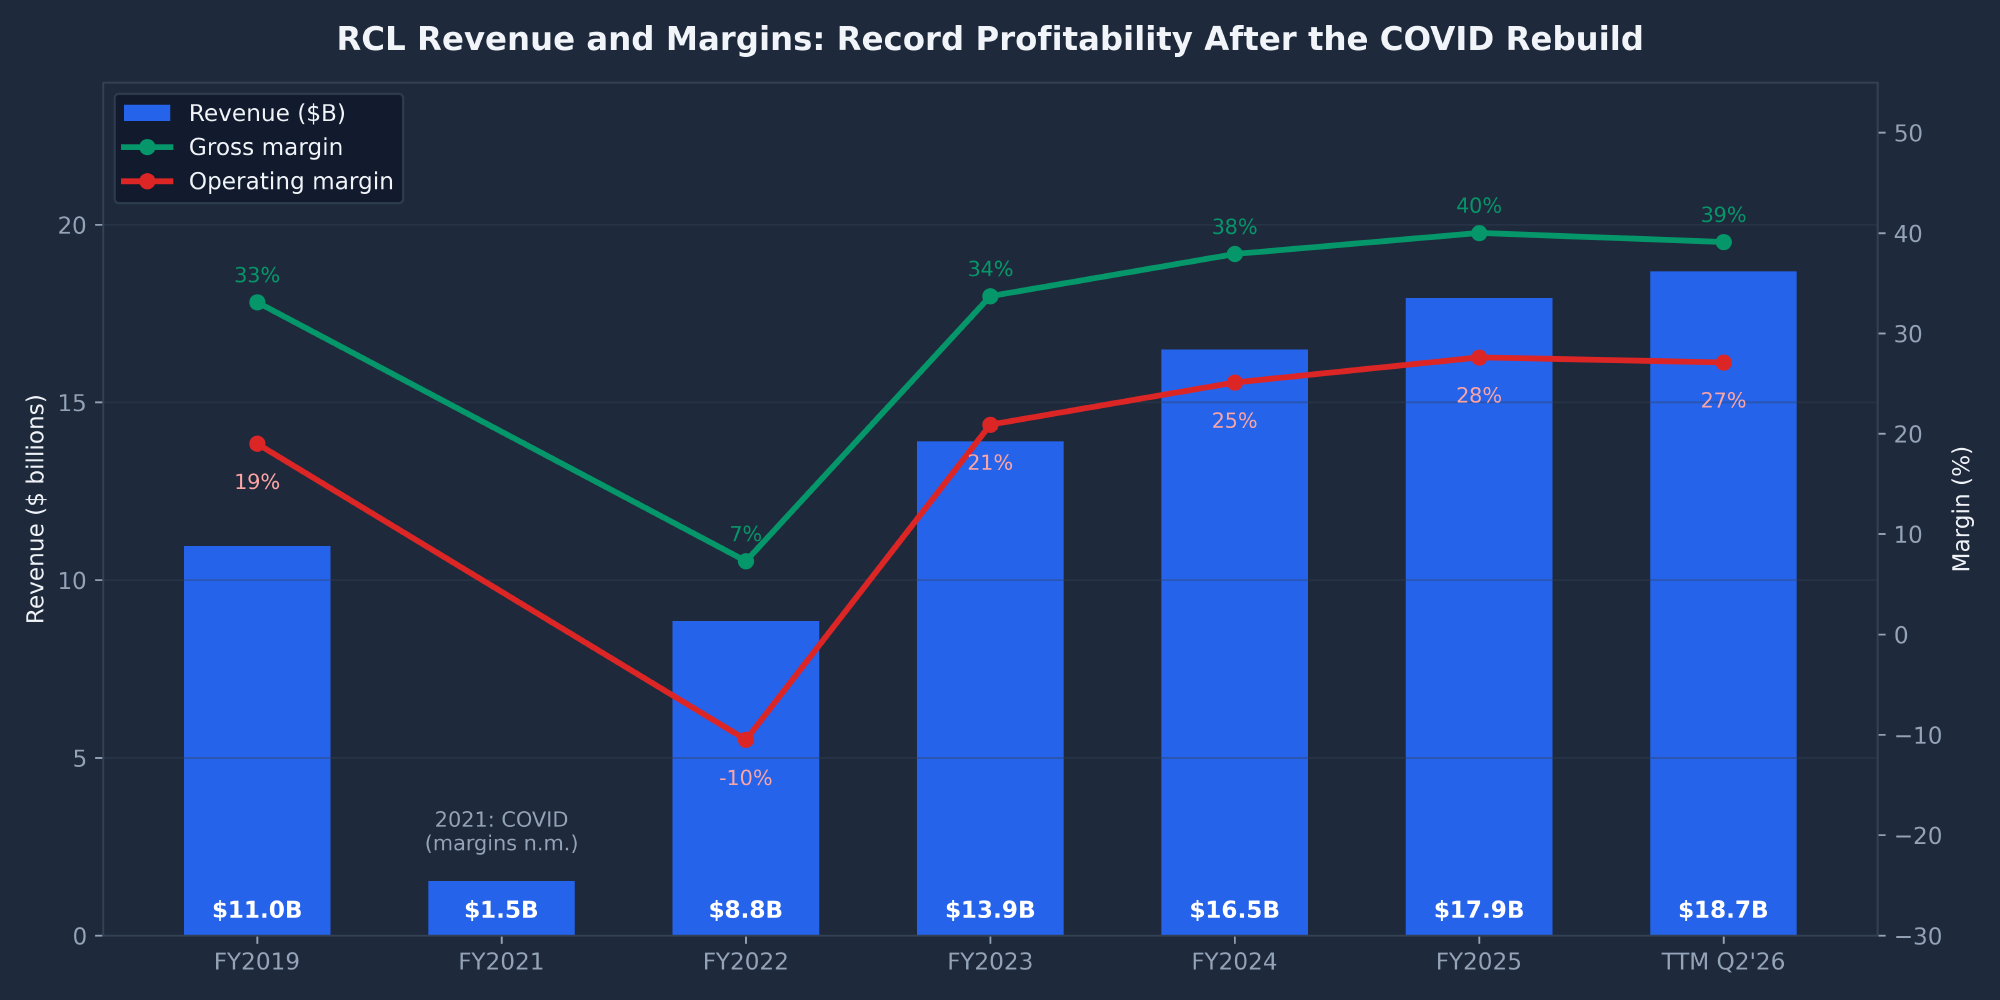
RCL Revenue and Income Statement (Annual)
| $M | FY2019 | FY2021 | FY2022 | FY2023 | FY2024 | FY2025 | TTM (Q2’26) |
|---|---|---|---|---|---|---|---|
| Revenue | 10,951 | 1,532 | 8,841 | 13,900 | 16,484 | 17,935 | 18,682 |
| Revenue growth | — | −31% | +477% | +57% | +18.6% | +8.8% | +8.7% |
| Gross profit | 3,626 | −2,444 | 641 | 4,684 | 6,249 | 7,168 | 7,303 |
| SG&A | 1,546 | 1,368 | 1,571 | 1,776 | 2,115 | 2,215 | 2,242 |
| Operating income | 2,081 | −3,812 | −930 | 2,908 | 4,134 | 4,953 | 5,061 |
| Interest expense | 397 | 1,258 | 1,352 | 1,330 | 1,172 | 998 | 1,007 |
| Unusual items | 44 | 210 | 207 | 125 | 435 | −27 | 52 |
| Net income | 1,879 | −5,261 | −2,156 | 1,697 | 2,877 | 4,268 | 4,398 |
| Diluted EPS (GAAP) | $8.95 | −$20.89 | −$8.45 | $6.00 | $10.94 | $15.63 | $16.19 |
| Adjusted EPS (company) | $9.54 | −$19.19 | −$7.50 | $6.77 | $11.80 | $15.64 | — |
| EBITDA (Finviz) | 3,312 | −2,535 | 460 | 4,345 | 5,711 | 6,649 | 6,858 |
| Adj. EBITDA (company) | — | −2,602 | 712 | 4,544 | 5,971 | 7,025 | — |
| Gross margin | 33.1% | n.m. | 7.3% | 33.7% | 37.9% | 40.0% | 39.1% |
| Operating margin | 19.0% | n.m. | −10.5% | 20.9% | 25.1% | 27.6% | 27.1% |
| Net margin | 17.2% | n.m. | −24.4% | 12.2% | 17.5% | 23.8% | 23.5% |
| Diluted shares (M) | 209 | 255 | 255 | 283 | 279 | 274 | 268 |
Quarterly Trend: The 2026 Deceleration
| $M | Q3’24 | Q4’24 | Q1’25 | Q2’25 | Q3’25 | Q4’25 | Q1’26 | Q2’26 | Q3’26E |
|---|---|---|---|---|---|---|---|---|---|
| Revenue | 4,886 | 3,761 | 3,999 | 4,538 | 5,139 | 4,259 | 4,452 | 4,832 | 5,600 |
| Revenue YoY | +5.2% | +13.2% | +11.3% | +6.5% | +9.0% | ||||
| Operating income | 1,639 | 641 | 950 | 1,335 | 1,712 | 945 | 1,151 | 1,253 | |
| Operating margin | 33.5% | 17.0% | 23.8% | 29.4% | 33.3% | 22.2% | 25.9% | 25.9% (vs 29.4%) | |
| Adj. EPS | $5.20 | $1.63 | $2.71 | $4.38 | $5.75 | $2.80 | $3.60 | $4.21 (−3.9% YoY) | $6.36 est. (guide $6.26–6.36) |
| EPS surprise | +3.3% | +8.9% | +6.3% | +7.2% | +1.1% | +0.1% | +11.2% | +5.7% |
Revenue is still growing high single digits on 5–7% capacity growth. But Q2 2026 was the first year-over-year EPS decline since the recovery ($4.21 vs. $4.38), with operating margin down 350 basis points. Payroll rose 23% (a heavy drydock schedule) and fuel rose 27%.
Net yield growth has decelerated from +11.6% (2024) to +3.7% (2025) to about +2% guided (2026), and Q3 yields are guided flat. The growth engine has shifted from pricing to capacity.
Balance Sheet (Annual)
| $M | FY2019 | FY2021 | FY2022 | FY2023 | FY2024 | FY2025 | Q2’26 |
|---|---|---|---|---|---|---|---|
| Cash | 265 | 2,756 | 1,935 | 497 | 388 | 825 | 875 |
| Total current assets | 1,163 | 3,600 | 3,205 | 1,792 | 1,705 | 2,211 | 2,115 |
| Net PP&E (ships) | 26,154 | 26,450 | 28,084 | 30,725 | 32,508 | 36,316 | 38,869 |
| Total assets | 30,320 | 32,258 | 33,776 | 35,131 | 37,070 | 41,619 | 44,644 |
| Customer deposits (in current liabilities) | — | 3,160 | 4,170 | 5,310 | 5,500 | 5,740 | 6,740 |
| Total current liabilities | 7,953 | 7,286 | 8,573 | 9,401 | 9,817 | 12,055 | 11,655 |
| Total debt | 11,733 | 21,454 | 23,822 | 21,995 | 20,604 | 21,902 | 23,407 |
| Total liabilities | 17,586 | 27,173 | 30,908 | 30,232 | 29,335 | 31,374 | 34,183 |
| Total equity | 12,734 | 5,086 | 2,869 | 4,899 | 7,735 | 10,245 | 10,461 |
| Book value / share | $58.26 | $19.96 | $11.24 | $18.42 | $28.13 | $37.12 | $38.27 |
| Tangible BV / share | $49.28 | $15.08 | $6.40 | $13.64 | $23.62 | $32.69 | — |
| Current ratio | 0.15 | 0.49 | 0.37 | 0.19 | 0.17 | 0.18 | 0.18 |
| Debt / equity | 0.92 | 4.22 | 8.30 | 4.49 | 2.66 | 2.14 | 2.24 |
| Net debt / Adj. EBITDA | ~3.4× | n.m. | 30.7× | 4.7× | 3.4× | 3.0× | ~3.1× (≈3.5× pro forma Sandals) |
Cash Flow (Annual)
| $M | FY2019 | FY2021 | FY2022 | FY2023 | FY2024 | FY2025 | TTM |
|---|---|---|---|---|---|---|---|
| Operating cash flow | 3,716 | −1,878 | 482 | 4,477 | 5,265 | 6,465 | 6,786 |
| CapEx | −3,025 | −2,230 | −2,710 | −3,897 | −3,268 | −5,229 | −7,202 |
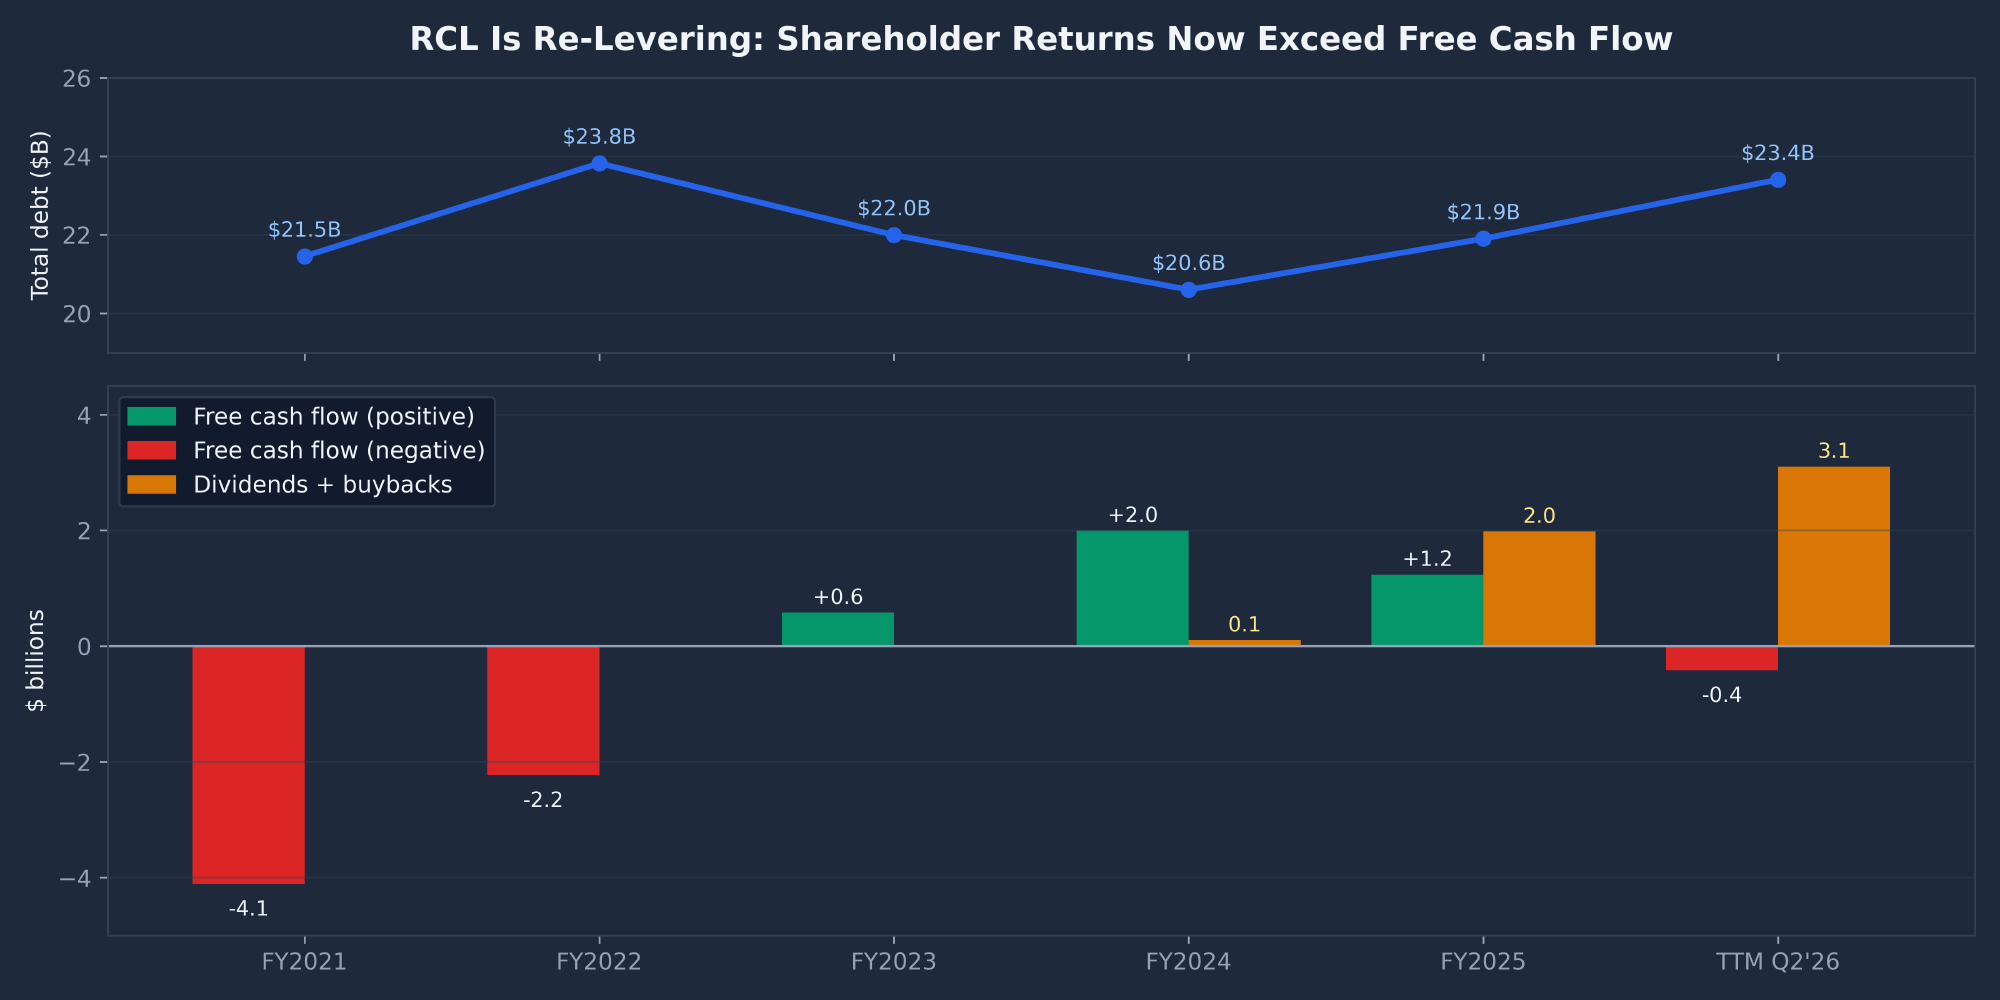
| Free cash flow | 692 | −4,108 | −2,228 | 580 | 1,997 | 1,236 | −416 |
| Dividends paid | −603 | 0 | 0 | 0 | −107 | −824 | −1,150 |
| Buybacks | −100 | 0 | 0 | 0 | 0 | −1,159 | −1,953 |
| Shareholder returns vs. FCF | 5% | 160% | n.m. (FCF negative) | ||||
| Debt issued | 3,475 | 4,266 | 9,535 | 7,447 | 10,185 | 4,553 | 9,464 |
| Debt repaid | −4,060 | −2,432 | −7,778 | −9,646 | −11,943 | −3,536 | −5,782 |
| Net debt change | +42 | +1,419 | +1,757 | −2,199 | −1,758 | +1,017 | +3,682 |
Forward caveat: the trailing figure is depressed by the heavy 2025–26 delivery schedule. On the ~$4.7 billion FY26 capex guide (1H26 already $3.24 billion), FY26 free cash flow should recover to roughly +$2 billion, and FY27 (~$4.2 billion capex) to about +$3 billion before the $3 billion Sandals outflow. The real squeeze is 2028 (~$6.4 billion capex).
2024 was the “deleveraging” year. Since 2025, shareholder returns have run ahead of free cash flow. With $4.6 billion (2028) and $3.6 billion (2029) of ship payments ahead, this is the single most important cash-flow trend to watch.
RCL Valuation Metrics
| Metric | Value | Interpretation |
|---|---|---|
| P/E (TTM) | 17.4× | vs. ~23× at the August 2025 peak and the S&P 500 at ~22×. Fair for a ~14% grower. |
| P/E on FY26 guide ($17.80 midpoint) | 15.9× | Reasonable; the market is pricing a slowdown. |
| Forward P/E (FY27 est. $20.31) | 13.9× | Cheap if the 2027 estimate (≈ Perfecta’s ~$20.39) is delivered. |
| PEG | 0.98 | At or below 1.0 = growth priced fairly. |
| EV / EBITDA (TTM) | 14.3× (≈13.5× on adj. EBITDA) | Premium to CCL/NCLH historically; reflects higher margins and an investment-grade balance sheet. |
| EV / Sales | 5.26× | ~$23B of debt makes EV 30% larger than market cap. |
| P/S | 4.04× | Elevated vs. history (2.6× in 2019) — margins are structurally higher now. |
| P/B · P/Tangible B | 7.4× · 8.6× | High, but ROE is 45%. |
| P/FCF | n.m. (TTM FCF negative); 61× on FY25 | The bear’s cleanest point: owners are not seeing free cash today. |
| Dividend | $1.50/quarter = $6.00/year (2.1%) | Payout ~34% of FY26 EPS; ex-date September 17, 2026. |
| Earnings yield | 5.7% (TTM) · 7.2% (FY27E) | vs. the 10-year Treasury at ~4.8% — a thin equity risk premium on trailing numbers. |
EV vs. market cap: buying all of RCL means paying $75.5 billion for the equity plus assuming $22.5 billion of net debt — about $98 billion, or $100 billion-plus once Sandals funds. Every 1× turn of EV/EBITDA on ~$7.4 billion of 2026 adjusted EBITDA is worth about $27 per share. Leverage amplifies multiple changes in both directions.
Peer Comparison: RCL vs. Cruise and Hotel Stocks
| Metric | RCL | CCL | NCLH | VIK | MAR | HLT |
|---|---|---|---|---|---|---|
| Market cap | $75.5B | $35.4B | $7.2B | $36.4B | $95.4B | $73.5B |
| P/E (TTM) | 17.4 | 11.5 | 9.8 | 27.1 | 37.9 | 48.0 |
| Forward P/E | 13.9 | 10.3 | 9.6 | 18.7 | 27.9 | 31.4 |
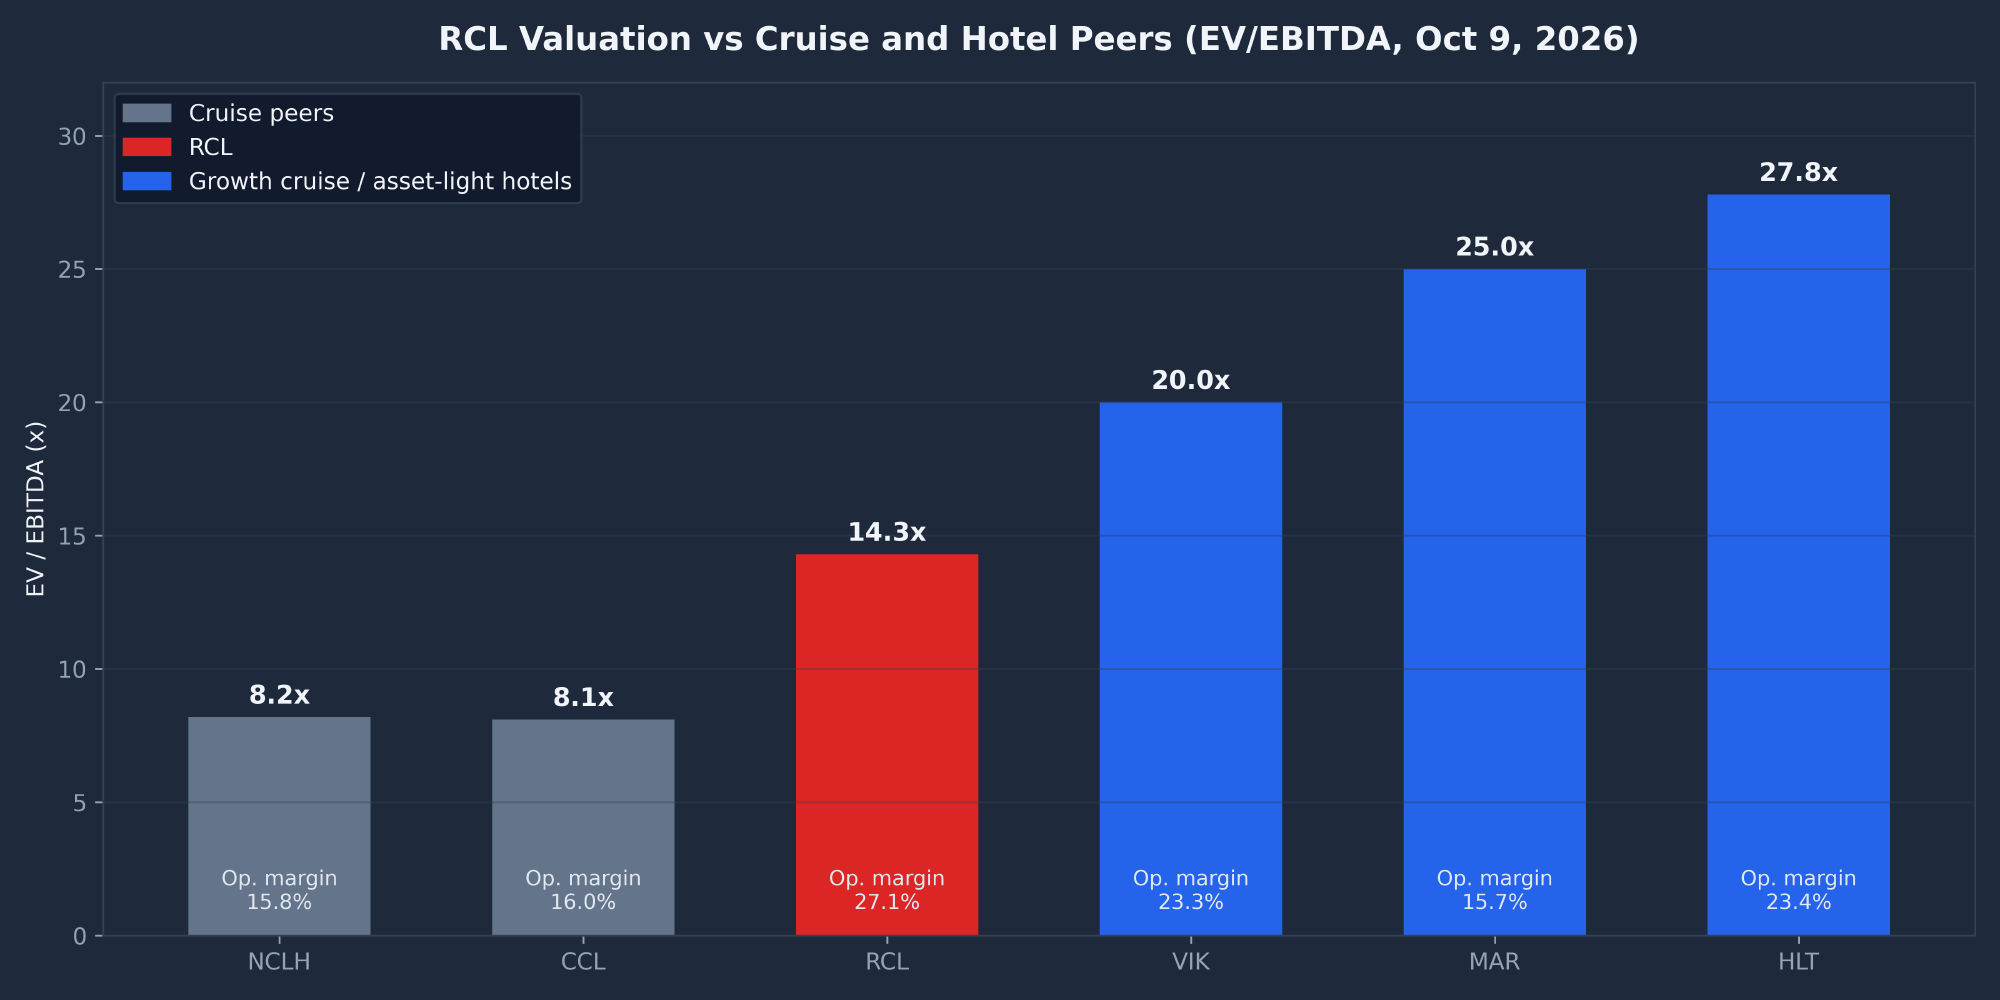
| EV/EBITDA | 14.3 | 8.1 | 8.2 | 20.0 | 25.0 | 27.8 |
| PEG | 0.98 | 0.97 | — | 0.70 | 2.08 | 2.30 |
| Operating margin | 27.1% | 16.0% | 15.8% | 23.3% | 15.7% | 23.4% |
| ROIC | 13.7% (company: 18%) | 8.5% | 4.4% | 17.7% | 20.2% | 22.3% |
| Debt/equity | 2.30 | 1.77 | 6.21 | 3.75 | neg. equity | neg. equity |
| EPS growth next year | 14.3% | 14.0% | 4.9% | 34.6% | 11.8% | 15.0% |
| Beta | 1.92 | 2.52 | 2.04 | 1.47 | 1.17 | 1.10 |
| Performance (1 year) | −8.1% | −7.4% | −33.2% | +37.8% | +37.5% | +25.6% |
| Analyst target upside | +25.7% | +25.6% | +23.1% | +34.2% | +5.2% | +9.0% |
RCL trades at a ~75% EV/EBITDA premium to Carnival and Norwegian (14.3× vs. ~8×). That premium is earned by margins 11 points higher and an investment-grade balance sheet. It trades at a ~30% discount to Viking (20×), the market’s preferred cruise growth story, and at roughly half the multiple of the asset-light hotel franchisors (25–28×).
The Sandals deal effectively asks the market to value part of RCL like a hotel company. The market’s first answer (−6% the day it was announced) was “no.” Note that RCL’s one-year performance is in line with CCL’s, while VIK, MAR and HLT are up 25–38%. Capital has rotated from cruise to asset-light travel. With the Sandals stake at only ~4% of EBITDA, the hotel-multiple argument can’t move RCL’s multiple much.
Key Metrics Summary
| Metric | Value | Metric | Value |
|---|---|---|---|
| ROE | 45.3% | ROIC (Finviz / company) | 13.7% / 18.0% |
| ROA | 10.6% | Adj. EBITDA margin (FY25) | 39.2% |
| Occupancy (Q2’26) | 110.2% | Net yield (Q2’26) | $288.95 (+1.2% constant currency) |
| Beta | 1.92 (Finviz) / 1.59 (2-year calc) | RSI (14) | 60.0 |
| SMA 20 / 50 / 200 | +9.0% / +1.2% / −1.6% | EPS growth this year / next year / 5-year | 13.7% / 14.3% / 14.2% |
| Effective tax rate | ~2% | Average cost of debt | 4.66% (93% fixed) |
| Fuel hedged 2026 / 2027 | 58% @ $474/mt / 53% @ $405/mt | Order book | $16.5B (52.6% euro-denominated) |
Short Interest History
| Date | Short Interest | % of Float | Days to Cover |
|---|---|---|---|
| Jun 30, 2020 | 26.63M | 15.64% | 1.1 |
| Nov 15, 2022 | 23.22M | 10.59% | 3.2 |
| Jul 31, 2023 | 21.35M | 9.65% | 5.4 |
| Jul 15, 2024 | 16.50M | 6.97% | 7.4 |
| Jun 30, 2025 | 13.74M | 5.57% | 5.4 |
| May 29, 2026 | 13.46M | 5.37% | 4.8 |
| Sep 15, 2026 | 10.17M | 4.07% | 4.7 |
| Sep 30, 2026 | 11.34M | 4.53% | 4.75 |
Short interest has normalized from 16% (2020) to about 4–5% and has been flat for 18 months — neither a crowded short nor squeeze fuel. It ticked up 1.2 million shares around the Sandals news.
The Fundamental Bull Case
1. Best-in-class economics in a structurally improved industry
RCL’s 2025 adjusted EBITDA margin of 39.2% and ROIC of 18.0% are records for the company and the industry — versus a 19% operating margin and ~9% ROIC in 2019. Unit costs ex-fuel were flat (−0.1%) in 2025 on 5.5% more capacity. This isn’t a cyclical peak in a commodity business. Newer, bigger ships (the Icon class “exceeded all expectations”) and private destinations have lifted the earnings power per berth.
2. Management that under-promises and over-delivers
Adjusted EPS beat the top of quarterly guidance 16 straight quarters (Q3’22–Q2’26). Initial full-year guides were beaten by +105% (2023), +23% (2024) and +8% (2025). The Trifecta targets were hit 18 months early. When this team guides $6.26–6.36 for Q3, history says the print is higher.
3. Earnings growth at a market-or-lower multiple
FY27 consensus EPS of $20.31 (≈ the Perfecta path of ~$20.39) puts RCL at 13.9× forward earnings with a 0.98 PEG, versus ~22× for the S&P 500. EPS has compounded from $6.77 (2023) to $15.64 (2025) to ~$17.80 (2026 guide) while the stock is flat over 14 months. The multiple has de-rated from ~23× to 17× trailing.
4. The customer-deposit float is a hidden funding engine
Customer deposits have grown every year: $3.16 billion (2021) → $5.74 billion (2025) → $6.74 billion (June 2026), 55% non-refundable. That is interest-free capital equal to ~29% of total debt. Caveat: June is the seasonal peak. Year-end to year-end, deposits grew only 4.4% in 2025 vs. 5.5% capacity growth, so per-berth deposits are flat, not accelerating.
5. Investment-grade balance sheet with cheap, fixed, unsecured debt
From 11.625% coupons with ships pledged as collateral (2022) to BBB−/Baa3/BBB, 93% fixed at a 4.66% average rate. New ships are financed at SOFR + 0.80–0.85% under export-credit guarantees. Interest expense fell from $1.35 billion (2022) to $998 million (2025).
6. Low tax, rising JV income, underappreciated optionality
A ~2% effective tax rate (Liberia, UK tonnage tax) and a TUI Cruises JV that earned $414 million of equity income in 2025 and paid a $258 million dividend. Sandals — 20 all-inclusive resorts for the price of ~1.5 Icon-class ships — extends the brand into the land-vacation wallet.
7. Demand is still there: 110% occupancy and record 2027 pricing
Occupancy was 110.2% in Q2 2026. Industry commentary (Carnival’s record Q3, “2027 half-booked at record prices”) and RCL’s own record 2027 pricing point to another year of positive yields, with capacity growth of +4% (2027) and +6% (2028).
The Fundamental Bear Case
1. The pricing engine is stalling
Net yield growth: +11.6% (2024) → +3.7% (2025) → ~+2% (2026 guide) → flat (Q3 2026 guide). Q2 2026 EPS fell 3.9% year over year and operating margin fell 350 basis points. Bulls point to record 2027 pricing, but “record” with ~2% growth plus heavier casino offers, repricing and 2×-points promotions is a very different story than 2023–24.
2. Free cash flow has gone negative while shareholder returns accelerate
TTM free cash flow is −$416 million against $3.1 billion of dividends and buybacks. FY26 should recover to ~+$2 billion as capex falls to the ~$4.7 billion guide, but 2028 capex of ~$6.4 billion brings the squeeze back. 1H26 free cash flow was ~$0.46 billion against ~$1.7 billion returned. The gap is debt-funded, and buybacks were executed at ~$286–288 per share (2025–Q1 2026) — above today’s price.
3. Leverage is drifting back up into a capex hump
Total debt is $23.4 billion (vs. $20.6 billion at year-end 2024) before the $3 billion Sandals bridge. Ship payments are $2.5 billion (2027), $4.6 billion (2028) and $3.6 billion (2029), colliding with $3.45 billion of 2028 debt maturities. Ratings already sit at the lowest investment-grade notch (BBB−/Baa3; S&P outlook positive), swap counterparties can demand collateral below that, and ~3.5× pro-forma leverage leaves little room for error.
4. Sandals dilutes returns
Paying ~10× forward EBITDA for a 50% equity stake that won’t consolidate into RCL’s EBITDA yields an estimated ~10% pre-depreciation return — below RCL’s 18% ROIC — and adds ~$160 million a year of new interest (≈$0.60 per share pre-tax). Because RCL books its share of Sandals’ net income (after Sandals’ own D&A, interest and maintenance capex), not EBITDA, real near-term accretion is likely close to zero. Management’s “accretive to 2027” claim is unverified, and the deal moves RCL into all-inclusive resorts — a business its own 10-K lists as a competitor.
5. Fuel and geopolitics are a recurring tax
The April 2026 guide cut ($0.62 per share from fuel alone), Brent at ~$108 in September, Mediterranean and Mexico itinerary disruption, and TUI’s Middle East exposure (Q2 JV income $67 million vs. $107 million). Only 58% of 2026 and 53% of 2027 fuel is hedged. Airlines took the same oil shock this spring; I covered that side of it in my Alaska Air (ALK) stock analysis.
6. Legal and destination overhangs that aren’t reserved
The U.S. Supreme Court revived the Havana Docks (Helms-Burton) claim in May 2026 after RCL had released $124 million of reserves in 2024. No new reserve has been booked, and treble damages are possible. Mexico’s SEMARNAT says it will deny the Perfect Day Mexico permit ($294 million already paid). Labadee remains closed.
7. High beta, high leverage, cyclical consumer
A beta of 1.6–1.9 and an EV 30% above market cap. Two 35–40% drawdowns in the last 20 months. A U.S. consumer slowdown hits a business with 74% U.S.-sourced ticket revenue and high fixed costs.
Fundamental Bottom Line
Fundamental Bull Target: $350
- Perfecta delivered: 2027 EPS ≈ $20.50
- Yields +3%, flat unit costs, fuel normalizes, Sandals neutral
- 17× (2025 average multiple) = ~$350 (+24%) by late 2027
Fundamental Bear Target: $205
- Yields turn negative in a consumer slowdown
- Fuel stays above $100 Brent; Sandals interest drag
- 2027 EPS ≈ $17.00 (flat vs. 2026) × 12× trough multiple = ~$205 (−27%)
Royal Caribbean is the highest-quality operator in a structurally better cruise industry — record margins, an 18% ROIC, investment-grade debt, and a management team with a near-perfect guidance record. At 15.9× 2026 and 13.9× 2027 earnings it is not expensive if earnings keep compounding at ~14%.
But 2026 marks a real regime change: pricing growth has faded to ~2%, Q2 EPS fell year over year, free cash flow is negative on a trailing basis, and management has pivoted from deleveraging to debt-funded buybacks and a $3 billion resort deal. The fundamentals justify owning RCL at a discount to its quality, not chasing it. The risk/reward is roughly balanced at $282, with the Q3 print and 2027 guide (which needs ~+14.6% EPS growth) as the deciding evidence.
Technical Analysis
This section uses daily and weekly bars from October 2023 through October 9, 2026. Indicators are computed from daily closes (Wilder RSI-14, MACD 12/26/9, ATR-14), with beta measured against SPY.
| Price | 52-Week Range | All-Time High | % From ATH | Beta (2Y vs SPY) | ATR (14) |
|---|---|---|---|---|---|
| $282.26 | $222.22 – $356.39 | $366.50 (Aug 29, 2025) | −23.0% | 1.59 | $11.90 (4.2%) |
RCL Technical Summary
| Indicator | Value | Price vs. Indicator | Signal |
|---|---|---|---|
| SMA 10 | $272.67 | +3.5% | BULLISH |
| EMA 10 | $273.58 | +3.2% | BULLISH |
| SMA 20 | $258.89 | +9.0% | BULLISH |
| SMA 50 | $278.95 (falling) | +1.2% | NEUTRAL (just reclaimed) |
| SMA 100 | $285.61 | −1.2% | BEARISH (overhead) |
| SMA 200 | $286.72 (flat) | −1.6% | BEARISH (overhead) |
| RSI (14) | 60.0 | Up from 19.2 on Sep 15 | BULLISH (momentum, not overbought) |
| MACD (12/26) | +3.16 | Crossed above zero Oct 7 | BULLISH |
| MACD signal | −2.09 | Bull crossover Sep 28 @ $242.59 | BULLISH |
| MACD histogram | +5.25 | Expanding 9 straight sessions | BULLISH |
| Volatility (20-day / 1-year annualized) | 48.3% / 48.2% | ~3× the S&P 500 | HIGH |
| Relative strength (1 year) | RCL −8.1% vs. SPY +16.0% | −24 points of underperformance | BEARISH |
Short-term momentum is unambiguously bullish: price is above the 10- and 20-day averages, MACD is positive and expanding, and RSI is 60. The intermediate trend is still damaged. The 100- and 200-day averages sit directly overhead, the 50-day is still rolling over, and the stock has badly lagged the market for a year.
The moving-average stack reads 20 ($259) < 10 ($273) < 50 ($279) < 100 ($286) < 200 ($287). That is a textbook bearish stack being repaired from the bottom up. Short interest is a modest 4.5% of float with 4.7 days to cover, so there is no squeeze fuel to help.
Price Structure: The Last Three Years
| Phase | Dates | Price Range | Move | Description |
|---|---|---|---|---|
| Post-COVID recovery rally | Oct 2023 – Jan 2025 | $78 → $277 | +255% | Relentless re-rating as yields, occupancy and EPS blew past pre-COVID levels; dividend reinstated 2024; investment-grade ratings restored. |
| Tariff / recession crash | Feb – Apr 2025 | $272 → $164 | −40% | Macro risk-off (tariffs, consumer fears). April 9, 2025 tariff-pause day: +16.3% on 5.7M shares — the 2025 bottom. |
| V-recovery to ATH | Apr – Aug 2025 | $164 → $366.50 | +123% | Q2 2025 beat on June 27 (12.1M shares, +4.6%, largest volume day in 18 months). All-time high $366.50 on August 29, 2025. |
| Distribution / downtrend | Sep – Nov 2025 | $363 → $245 | −33% | October 28, 2025 Q3 report: −8.5% gap-down on 8.6M shares. Second gap down November 4. RSI below 25 in November. |
| Q4 earnings re-rate | Dec 2025 – Feb 2026 | $245 → $356 | +45% | January 29, 2026 Q4 report: +18.65% single-day gap on 7.7M shares and a 50% dividend hike. A lower high vs. the ATH ($356 vs. $366). |
| Oil-shock chop | Mar – May 2026 | $356 → $232 | −35% | Iran conflict and the Strait of Hormuz closure sent crude above $90. Violent two-way trade: +10% on April 17 as Hormuz reopened, then a sharp drop on Iran’s UAE strike (May 4). |
| Summer rally | Jun – Aug 4, 2026 | $266 → $334 | +26% | Q1 beat (April 30, +3.8%) plus a June 15 gap up; July 28 Q2 beat-and-raise (+5.7% to $322.50). Another lower high ($334). |
| Late-summer breakdown and capitulation | Aug – Sep 23, 2026 | $334 → $222.22 | −33% | A grinding decline on oil (Brent ~$108) and consumer fears (RSI below 30 for 4 weeks), then capitulation on September 22–23 on the $3B Sandals 50% stake announcement: −6.1% and −2.0% on 8.4M and 7.6M shares (3.5× average). Weekly volume of 26.4M was the heaviest in the dataset. |
| V-bounce (current) | Sep 24 – Oct 9, 2026 | $222 → $289 (now $282) | +27% | September 29: +7.45% gap on 4.0M shares as BofA, Deutsche Bank and later Jefferies upgraded to Buy (~$330 targets); the best week since January 2025 (+14.4%). Stalled at $289.17 on October 6. |
RCL Support and Resistance Levels
Resistance
| Level | Significance | Strength |
|---|---|---|
| $285.6 – $289.3 | Confluence zone: SMA 100 ($285.61) + SMA 200 ($286.72) + October 6 rejection high ($289.17) + 50% retrace of the February–September decline ($289.31) + 38.2% retrace of the 2025 rally ($289.15) | VERY STRONG |
| $300 – $305 | August 2026 breakdown shelf (August 14–19 closes of $300–305) + 61.8% retrace of the decline ($305.14) + psychological $300 | STRONG |
| $318 – $319 | 23.6% retrace of the 2025 rally ($318.71); June/July 2026 closing highs ($317–318) | MODERATE |
| $334 | August 2026 swing high — the most recent lower high. A break re-establishes an uptrend. | STRONG |
| $356 – $366.50 | February 10, 2026 high ($356.39) and the all-time high ($366.50, August 29, 2025) — double-top zone | MAJOR |
Support
| Level | Significance | Strength |
|---|---|---|
| $277 – $279 | SMA 50 ($278.95) + October 8–9 lows ($277.11 / $278.00) + a small unfilled gap from October 5–6 ($277.08–$278.00) | MODERATE |
| $269 – $271 | October 1 high / October 5 low ($269.69) + an unfilled gap from October 1–2 ($270.86–$271.56) | MODERATE |
| $262 – $265 | Late-August / early-September base ($262–265 for 6 sessions) + 50% retrace of the 2025 rally ($265.26) | STRONG |
| $250 – $254 | Unfilled breakaway gap from September 28–29 ($249.73–$254.21) + April 2026 low ($250.38) + September 16–21 pivots | STRONG (gap magnet) |
| $240 – $245 | 61.8% retrace of the 2025 rally ($241.36) + September 25–28 base + November 2025 low ($244.45) | STRONG |
| $222 – $232 | September 23, 2026 capitulation low ($222.22) + May 2026 low ($232.10). Thesis-break level for longs. | MAJOR |
Fibonacci Retracements
A. 2025 rally: $164.01 (April 2025 low) → $366.50 (August 2025 all-time high). Fibonacci retracement levels:
| Level | Price | Status |
|---|---|---|
| 23.6% | $318.71 | Broken (August 2026); now resistance |
| 38.2% | $289.15 | Rejected October 6 ($289.17 high) — the current ceiling |
| 50.0% | $265.26 | Broken September 2026, reclaimed September 30 |
| 61.8% | $241.36 | Undercut intraday September 22–23 (low $222), closed back above September 24 — a classic “golden pocket” flush-and-reclaim |
| 78.6% | $207.35 | Not tested — held |
B. 2026 decline: $356.39 (February 10 high) → $222.22 (September 23 low). These are the retracement targets for the bounce:
| Level | Price | Status |
|---|---|---|
| 23.6% | $253.88 | Cleared September 29 (gap) |
| 38.2% | $273.47 | Cleared October 2 |
| 50.0% | $289.31 | Tested and rejected October 6 |
| 61.8% | $305.14 | Not tested — next target on a breakout |
| 78.6% | $327.68 | Not tested |
Moving Average Analysis
| MA | Value | Distance | Analysis |
|---|---|---|---|
| SMA 10 | $272.67 | +3.5% | Rising sharply; first pullback buyers will defend it. |
| SMA 20 | $258.89 | +9.0% | Turned up; a 9% extension above the 20-day after a 27% bounce argues for consolidation before the next leg. |
| SMA 50 | $278.95 | +1.2% | Reclaimed October 6 after spending August 20 – October 5 below it. Still declining (~$0.80/day) — it will keep falling toward price unless RCL rallies. |
| SMA 100 | $285.61 | −1.2% | Overhead; the first test. |
| SMA 200 | $286.72 | −1.6% | Flat for about a year. A flat 200-day means no long-term trend; RCL has crossed it 8+ times in 12 months. |
The 50-, 100- and 200-day averages are compressed into a $279–$287 band (3% wide). Compressed averages precede expansion. The next decisive move out of this band will likely run 10–15% in its direction.
RSI Analysis
| Date | Close | RSI (14) | Zone |
|---|---|---|---|
| Nov 6, 2025 | $253.57 | 24.2 | Oversold (preceded a +45% rally) |
| Jan 29, 2026 | $345.98 | 74.5 | Overbought (the only reading above 72 in 12 months; marked the 2026 high zone) |
| Aug 31, 2026 | $268.74 | 27.1 | Oversold begins |
| Sep 15, 2026 | $249.30 | 19.2 | Extreme oversold — lowest in 12 months |
| Sep 23, 2026 | $230.30 | 20.5 | Higher RSI on a lower price low = bullish divergence |
| Sep 29, 2026 | $260.67 | 50.2 | Neutral reclaimed |
| Oct 6, 2026 | $288.78 | 65.3 | Strong, not overbought |
| Oct 9, 2026 | $282.26 | 60.0 | Neutral-bullish |
RSI spent 17 consecutive sessions below 30 (August 31 – September 23) — an unusually long oversold streak for a large cap, signalling forced or systematic selling rather than a fundamental re-rate. The September 23 price low came with a higher RSI low than September 15 (20.5 vs. 19.2), a positive divergence that confirmed the capitulation.
RCL has historically topped out with RSI in the mid-70s. At 60 there is room for another 5–8% before momentum is stretched.
MACD Analysis
| Date | MACD | Signal | Histogram | Read |
|---|---|---|---|---|
| Aug 11, 2026 | — | — | — | Bear crossover @ $307 — preceded the 28% slide |
| Sep 23, 2026 | −14.14 | −12.35 | −1.79 | Trough (deepest reading of the year) |
| Sep 28, 2026 | −12.82 | −12.82 | 0.00 | Bull crossover @ $242.59 |
| Oct 2, 2026 | −4.16 | −9.33 | +5.17 | Histogram expanding |
| Oct 7, 2026 | +1.33 | −4.84 | +6.17 | MACD crosses the zero line |
| Oct 9, 2026 | +3.16 | −2.09 | +5.25 | Histogram has peaked (+6.17 → +5.25) — momentum decelerating as price consolidates |
The MACD has given 8 crossover signals in the last 6 months. This is a choppy, range-bound tape where MACD whipsaws. The September 28 bull cross was the best-timed signal of the year, within 9% of the low.
The histogram rolling over while price holds near the highs is healthy consolidation if price holds $277. It becomes a failed rally if MACD rolls back under its signal line below $270.
Volume Analysis
| Date | Close | Change | Volume | vs. 50-Day Avg (2.37M) | Event |
|---|---|---|---|---|---|
| Jun 27, 2025 | $309.51 | +4.6% | 12.06M | 5.1× | Q2 2025 earnings beat — breakout to new highs |
| Oct 28, 2025 | $292.95 | −8.5% | 8.60M | 3.6× | Q3 2025 earnings gap-down |
| Jan 29, 2026 | $345.98 | +18.7% | 7.71M | 3.3× | Q4 2025 earnings + 2026 guide + dividend hike |
| Apr 17, 2026 | $285.48 | +7.3% | 5.46M | 2.3× | Strait of Hormuz reopens; crude −14% |
| May 20, 2026 | $253.89 | +2.7% | 6.64M | 2.8× | May 2026 low reversal |
| Jun 26, 2026 | $318.13 | −1.4% | 7.23M | 3.1× | Carnival guide spillover (dropped, then recovered) |
| Sep 22, 2026 | $234.89 | −6.1% | 8.40M | 3.5× | Capitulation day 1 — Sandals headlines (talks scoop, then the $3B / 50% debt-funded stake). Opened +3.5% and reversed to −6% (intraday range $231–$262). |
| Sep 23, 2026 | $230.30 | −2.0% | 7.59M | 3.2× | Capitulation day 2 — low $222.22, closed 8 points off the low |
| Sep 24, 2026 | $238.98 | +3.8% | 5.48M | 2.3× | Reversal day — demand shows up |
| Sep 29, 2026 | $260.67 | +7.5% | 4.04M | 1.7× | Sell-side upgrades (BofA, Deutsche). Breakaway gap (unfilled, $249.73–$254.21) |
| Oct 9, 2026 | $282.26 | +0.3% | 1.59M | 0.7× | Volume drying up into resistance |
The week of September 21 printed 26.4 million shares — the heaviest weekly volume in the 30-month dataset — at the lows. That is what a selling climax looks like.
The bounce has come on declining volume (4.0M → 3.4M → 2.4M → 1.6M). That is normal for a relief rally, but it means the move into $289 has not yet been confirmed by institutional demand. A breakout above $289 needs more than 3.5 million shares to be trusted.
Volatility Profile
| Metric | Value | Interpretation |
|---|---|---|
| Beta (1Y / 2Y / 3Y vs. SPY; Finviz 5Y) | 1.60 / 1.59 / 1.56; Finviz 1.92 | Moves ~1.6× the market — a 10% S&P drawdown implies ~16% for RCL before stock-specific news. |
| ATR (14) | $11.90 computed (4.2%); Finviz $9.62 (3.4%) | The normal daily range is ±$12; a 2-ATR stop is ~$24 (8.5%). |
| Realized volatility (20-day / 1-year); Finviz weekly/monthly | 48.3% / 48.2%; 2.72% / 3.71% daily | Persistently elevated; options will price ~$30–35 monthly moves. |
| Max drawdown (Aug 2025 → Sep 2026, closes) | −37.0% | $365.80 → $230.30. |
| Max drawdown (Jan → Apr 2025) | −40% (intraday) | $277 → $164. |
| Earnings-day moves (last 8) | Jul ’26 +5.7%, Apr ’26 +3.8%, Jan ’26 +18.7%, Oct ’25 −8.5%, Jul ’25 −5.0%, Apr ’25 +0.1%, Jan ’25 +12.0%, Oct ’24 +3.2% | Average absolute earnings-day move ≈ 7.1%. The Q3 2026 report is scheduled for October 27, 2026. |
Recent Price Action (Last 15 Sessions)
| Date | Open | High | Low | Close | Volume | Change |
|---|---|---|---|---|---|---|
| Sep 18 | 250.00 | 251.46 | 245.06 | 245.81 | 3.20M | −1.57% |
| Sep 21 | 250.50 | 252.15 | 246.30 | 250.25 | 2.22M | +1.81% |
| Sep 22 | 259.00 | 261.66 | 231.03 | 234.89 | 8.40M | −6.14% |
| Sep 23 | 236.14 | 237.13 | 222.22 | 230.30 | 7.59M | −1.95% |
| Sep 24 | 234.30 | 243.18 | 232.00 | 238.98 | 5.48M | +3.77% |
| Sep 25 | 241.80 | 246.25 | 236.72 | 242.70 | 2.70M | +1.56% |
| Sep 28 | 246.00 | 249.73 | 240.20 | 242.59 | 3.37M | −0.05% |
| Sep 29 | 257.20 | 261.99 | 254.21 | 260.67 | 4.04M | +7.45% |
| Sep 30 | 260.20 | 269.65 | 259.00 | 265.86 | 4.29M | +1.99% |
| Oct 1 | 266.12 | 270.86 | 263.22 | 269.99 | 3.09M | +1.55% |
| Oct 2 | 275.18 | 279.50 | 271.56 | 277.74 | 3.42M | +2.87% |
| Oct 5 | 277.03 | 277.08 | 269.69 | 275.03 | 3.03M | −0.98% |
| Oct 6 | 279.80 | 289.17 | 278.00 | 288.78 | 2.36M | +5.00% |
| Oct 7 | 285.01 | 288.14 | 281.11 | 282.32 | 2.42M | −2.24% |
| Oct 8 | 277.66 | 283.56 | 277.11 | 281.41 | 1.96M | −0.32% |
| Oct 9 | 282.00 | 283.55 | 278.00 | 282.26 | 1.59M | +0.30% |
Chart Patterns and Structure
| Pattern | Status | Implication |
|---|---|---|
| Selling climax / V-bottom (Sep 22–24) | Confirmed | Record weekly volume + RSI divergence + a 27% reversal. Capitulation lows like this are rarely revisited quickly. |
| Lower-highs descending range since Aug 2025 | Active | $366.50 → $356 → $334 → $289. The long-term trend is not up until $334 breaks. |
| Bull flag / tight consolidation $277–$289 (Oct 6–9) | Forming | Three days of narrowing range on falling volume under resistance. Resolves with Q3 earnings. |
| Unfilled gap $249.73–$254.21 (Sep 28/29) | Open | A breakaway gap; a fill would put price back at the 61.8% / gap-fill zone and test the bottom. |
| MA compression $279–$287 | Active | Precedes a 10–15% directional expansion. |
| Broad 2025–2026 range $222–$366 | Active (price mid-range) | RCL has been a 14-month range trade; $282 sits at the 45th percentile of the range. |
Technical Scenarios
Bullish (45%)
- Trigger: a daily close above $289.30 on more than 3.5M shares (likely an earnings catalyst).
- Setup: reclaims the 200-day, completes the V-bottom and turns the 50-day back up; MACD stays above zero.
- Targets: $305 (61.8% of the decline) → $318–319 → $334 (lower-high pivot). Above $334 opens $356–366.
- Invalidation: a close back below $269.
Bearish (35%)
- Trigger: a second rejection at $287–$289 followed by a close below $269.
- Setup: the bear-market rally into the 200-day fails (a 4th lower high); MACD rolls under its signal.
- Targets: $262–265 → gap fill $250–254 → $241 (61.8%). Below $230 a retest of $222 is likely.
- Invalidation: a close above $295.
The remaining ~20%: sideways chop between $265 and $295 through earnings.
Technical Bottom Line
RCL’s chart is a tale of two timeframes. On the daily, the September washout has every hallmark of a durable low: the heaviest volume week in 30 months, a 17-session oversold streak, a bullish RSI divergence, a flush-and-reclaim of the 61.8% Fibonacci level, and a breakaway gap that remains unfilled. Momentum has flipped bullish and the stock rebuilt to the top of its moving-average stack in just 12 sessions.
On the weekly, the stock is still in a 14-month range of lower highs and has underperformed the S&P by 24 points over the past year. The $285.6–$289.3 band is the most important level on the chart, and the first test on October 6 was rejected. Key levels: $289.30 above (breakout) and $269 / $262 below (failure). The Q3 print on October 27 — management’s first chance to defend the Sandals deal on a call — is the likely catalyst that resolves it.
SEC Filings Deep Dive
I went through every Royal Caribbean Cruises Ltd. filing on SEC EDGAR from October 2021 through September 2026: every 10-K, 10-Q and proxy, plus each material 8-K and its exhibits. Q3 2026 results are not yet filed (due October 27).
| Ticker / CIK | Filings Analyzed | Date Range | Amendments | Management Credibility |
|---|---|---|---|---|
| RCL · 0000884887 | 105 filings + 42 EX-99 exhibits | Oct 2021 – Sep 2026 | None (0 × 10-K/A, 0 × 10-Q/A) | HIGH (8/10) |
Filing Inventory
| Form | Count | Coverage | Notes |
|---|---|---|---|
| 10-K | 5 | FY2021 (filed 3/1/22) → FY2025 (filed 2/11/26) | Risk-factor sections read and compared year over year |
| 10-Q | 15 | Q3 2021 → Q2 2026 (filed 7/28/26) | Debt, commitments and contingencies footnotes |
| DEF 14A | 5 | 2022 → 2026 (filed 4/17/26) | Compensation targets vs. payouts, ownership tables |
| 8-K | 80 (+42 EX-99) | Earnings (19 releases), financings, executive changes, Sandals (9/23/26) | All guidance extracted from EX-99.1 |
| 10-K/A, 10-Q/A | 0 | — | No restatements by amendment. One unexplained figure change: the 2024 average debt rate was 5.03% in the FY24 10-K and 4.76% in the FY25 10-K. |
Company History and Corporate Structure
| Date | Event |
|---|---|
| 1968 | Founded by Arne Wilhelmsen (Norway); the A. Wilhelmsen family still owns 6.1%. Incorporated in Liberia, where a 4.9% ownership cap applies (without board consent) to everyone except Wilhelmsen and Cruise Associates. Large institutions above 4.9% hold under board-granted exemptions. |
| 1993 | NYSE IPO |
| 1997 / 2018 | Acquired Celebrity Cruises / Silversea Cruises (Silversea goodwill headroom today: 98%) |
| 2020–2022 | COVID shutdown: FY21 net loss of $(5.26)B at 49.3% occupancy; raised debt at up to 11.625%, secured by ships; ~16.5M shares issued via convertibles |
| Jan 2022 | Richard Fain hands the CEO role to Jason Liberty (CFO since 2013); Naftali Holtz (ex-Goldman) becomes CFO |
| Nov 2022 | “Trifecta” program announced (deadline end-2025) — achieved 18 months early |
| 2024 | Debt becomes fully unsecured; dividend reinstated (July 2024) |
| 2025 | Investment grade at all three agencies; “Perfecta” program (March 2025); Fain steps down as Chair (Q4) — Liberty becomes Chairman & CEO |
| Sep 23, 2026 | 8-K: agreement to buy 50% of Sandals and Beaches Resorts for ~$3B (~10× forward EBITDA), funded by committed Morgan Stanley debt; JV board led jointly by Adam Stewart and Liberty; close early 2027 |
Revenue Mix and Unit Economics
RCL reports one segment, so the useful cuts are revenue type, itinerary geography and unit economics.
| $M | FY21 | FY22 | FY23 | FY24 | FY25 | 1H26 |
|---|---|---|---|---|---|---|
| Total revenue | 1,532 | 8,840 | 13,900 | 16,484 | 17,935 | 9,284 (+8.7%) |
| Passenger ticket share | 61.4% | 65.5% | 68.8% | 69.8% | 69.8% | 68.6% |
| Onboard share | 38.6% | 34.5% | 31.2% | 30.2% | 30.2% | 31.4% ↑ |
| North America itineraries | 1,040 | 5,716 | 8,707 | 10,594 | 11,542 (64%) | 6,269 |
| Europe | 180 | 1,754 | 2,685 | 2,697 | 2,951 | 1,085 |
| Asia/Pacific | 128 | 372 | 993 | 1,380 | 1,716 | 960 |
| Other itineraries | 78 | 540 | 847 | 1,025 | 862 | 501 |
| Other revenue | 106 | 458 | 668 | 788 | 864 | 469 |
| Unit Economics | FY22 | FY23 | FY24 | FY25 | Q1’26 | Q2’26 |
|---|---|---|---|---|---|---|
| Passengers | 5.54M | 7.65M | 8.56M | 9.45M | 2.5M | 2.40M |
| Occupancy | 85.1% | 105.6% | 108.5% | 109.7% | 109% | 110.2% |
| Net yield | $167.15 | $236.38 | $263.59 | $273.51 | — | $288.95 |
| Net yield growth (constant currency) | — | +13.5% vs. 2019 | +11.6% | +3.7% | +2.0% | +1.2% |
| NCC ex-fuel / APCD growth (constant currency) | — | +7.9% vs. 2019 | +6.8% | −0.1% | −0.5% | +3.9% |
| Adj. EBITDA / APCD | ~$17 | $96.85 | $118.13 | $131.75 | — | $134.84 (vs. $143.00, −5.7%) |
| Adj. EBITDA margin | 8.0% | 32.7% | 36.2% | 39.2% | — | 37.9% |
| ROIC | — | 12.3% | 16.1% | 18.0% | — | — |
Strategic read: the mix is shifting toward North America (64% of FY25 revenue, up from 57% in 2022) and short Caribbean itineraries anchored on private destinations, and away from Europe (1H26 Europe revenue fell as Mediterranean itineraries were disrupted).
Onboard revenue’s share is climbing again (31.4%), with ~50% pre-booked and ~90% of pre-cruise purchases made digitally. RCL is monetizing each guest more intensively, which is consistent with the Reddit complaints about “nickel-and-diming.” Pricing growth has decelerated sharply; the 2026 story is capacity (+6.6%) rather than yield.
Revenue and Profitability Deep Dive
| Item | Finding |
|---|---|
| Customer concentration | None — a consumer business with 9.45M passengers. U.S.-sourced guests were 74% of ticket revenue in 2025 and 78% in Q2 2026 (rising U.S. dependence). |
| Customer deposits (forward-demand proxy) | $1.78B (2020) → $3.16B → $4.17B → $5.31B → $5.50B → $5.74B (2025) → $6.74B (June 2026); $3.7B (55%) non-refundable |
| TUI Cruises JV | Carrying value $990M; equity income $200M (2023) → $260M (2024) → $414M (2025); first large dividend of $258M (2025). Q2 2026 equity income fell to $67M (from $107M) on Middle East itineraries. RCL cannot go below 37.55% ownership until May 2033. |
| China | Barely reopened; the 2026 guide carries a 30-basis-point yield headwind from China itinerary changes. |
| Q2 2026 cost pressure | Payroll +23% (more drydocks, crew movement), fuel +27%; operating income and adjusted EBITDA down year over year. |
| Capacity growth | +6.6% (2026), +4% (2027), +6% (2028), +7% (2029) — vs. an industry order book of ~3% a year. |
Management Credibility Scorecard
Quarterly adjusted EPS: guidance vs. actual (16 for 16 above the top of the range)
| Quarter | Guide | Actual | Quarter | Guide | Actual |
|---|---|---|---|---|---|
| Q3’22 | 0.05–0.25 | 0.26 | Q3’24 | 4.90–5.00 | 5.20 |
| Q4’22 | (1.50)–(1.30) | (1.12) | Q4’24 | 1.40–1.45 | 1.63 |
| Q1’23 | (0.85)–(0.65) | (0.23) | Q1’25 | 2.43–2.53 | 2.71 |
| Q2’23 | 1.50–1.60 | 1.82 | Q2’25 | 4.00–4.10 | 4.38 |
| Q3’23 | 3.38–3.48 | 3.85 | Q3’25 | 5.55–5.65 | 5.75 |
| Q4’23 | 1.05–1.10 | 1.25 | Q4’25 | 2.74–2.79 | 2.80 (barely) |
| Q1’24 | 1.10–1.20 | 1.77 | Q1’26 | 3.18–3.28 | 3.60 |
| Q2’24 | 2.65–2.75 | 3.21 | Q2’26 | 3.83–3.93 | 4.21 |
| Q3 2026 guide: $6.26–6.36 with net yields ~flat — reports October 27 | |||||
Promise vs. delivery
| Filing / Date | Promise / Guidance | Actual Outcome | Verdict |
|---|---|---|---|
| 8-K Oct 2021 | “Profitable for full year 2022” | FY22 net loss of $(2.16)B | MISSED |
| 8-K Feb 2022 | Profitable in 2H 2022 | Q3 +$33M, Q4 $(500)M | MISSED |
| 8-K Feb 2022 | Positive operating cash flow by spring 2022; full fleet back by summer | April 2022 / June 2022 | DELIVERED |
| 8-K 2022 | Load factors above 100% by year-end 2022 | 95% overall (holiday ~110%) | PARTIAL |
| Trifecta (Nov 2022) | EBITDA/APCD ≥$100, EPS ≥$10, ROIC ≥13%, investment grade — by end-2025 | $118.13 / $11.80 / 16.1% in 2024; investment grade at all three agencies by 2025 | DELIVERED EARLY |
| 8-K Feb 2023 | Repay more than $3.5B of debt in 2023; leverage below 3.5× by YE24 | ~$4B repaid; ~3.4×; S&P BBB− in Q1 2025 | DELIVERED |
| FY23 initial guide | Adj. EPS $3.00–3.60 | $6.77 (+105% vs. midpoint) | DELIVERED |
| FY24 initial guide | Adj. EPS $9.50–9.70 | $11.80 (+23%) | DELIVERED |
| FY25 initial guide | Adj. EPS $14.35–14.65 | $15.64 (+8%) | DELIVERED |
| FY23 / FY24 guides | NCC ex-fuel +4.75–5.75% / +3.75–4.25% | +7.9% / +6.8% (stock-comp re-marks) | MISSED |
| Feb 2023 | 2024 capacity +10% | +7.7% | PARTIAL |
| FY26 initial guide (Jan 2026) | Adj. EPS $17.70–18.10; net yield +1.5–3.5% | Cut to $17.10–17.50 (April: fuel $0.62, geopolitics, TUI) → raised to $17.73–17.87 (July); yield narrowed to 1.75–2.25%. The midpoint is still below the original. | IN PROGRESS (first cut) |
| Perfecta (Mar 2025) | 20% adjusted EPS CAGR 2024–27 (≈$20.39 in 2027); ROIC ≥17% | ROIC already 18.0%; the 2026 midpoint implies a ~23% two-year CAGR; 2027 needs ~+14.6% | IN PROGRESS (on track) |
| Destinations | Royal Beach Club Paradise Island (2025); Santorini (summer 2026) | Opened December 2025; launched by April 2026 | DELIVERED |
| Destinations | Puerto Williams hotel (2025); Royal Beach Club Cozumel (2026) | Still “on the horizon”; no opening disclosed | MISSED / slipping |
| Destinations | Perfect Day Mexico (2027) | SEMARNAT says it will deny the permit; Q2 2026 filings are silent | AT RISK |
Verdict: points come off for the wrong 2021–22 profitability calls, two years of unit-cost misses, the 2026 guidance cut, beats shrinking toward zero (Q4 2025 was +0.1%), chronically optimistic land-destination timelines — and compensation targets set far below public goals. Discount their guidance less than you would for most companies, but expect the size of the beats to keep shrinking.
Debt and Liquidity Analysis
| $M | YE21 | YE22 | YE23 | YE24 | YE25 | 6/30/26 |
|---|---|---|---|---|---|---|
| Total debt | 21,454 | 23,822 | 21,995 | 20,604 | 21,902 | 23,407 |
| Cash | 2,702 | 1,935 | 497 | 388 | 825 | 875 |
| Net debt / Adj. EBITDA | n.m. | 30.7× | 4.7× | 3.4× | 3.0× | ~3.1× (≈3.5× pro forma Sandals) |
| Average interest rate | 5.47% | 6.23% | 6.06% | 5.03%* | 4.69% | 4.66% |
| % fixed (after swaps) | 65.7% | 75.0% | 83.2% | 92.3% | 93% | — |
*The 2024 average rate was shown as 5.03% in the FY24 10-K and restated to 4.76% in the FY25 10-K without explanation.
Debt mix (June 30, 2026)
| Instrument | Outstanding | Rate | Notes |
|---|---|---|---|
| Fixed senior unsecured notes | $12.04B | 5.52% | Includes 4.75% ’33 and 5.25% ’38 ($1.25B each, 2026) and 5.55% ’34 ($1.25B, August 2026) |
| Fixed term loans (mostly export-credit ship loans) | $8.45B | 3.33% | Government-guaranteed; ~80% of future ship payments are financed this way |
| Floating USD term loans | $2.28B | 5.04% | |
| Euro term loans / revolver drawn / finance leases | $0.18B / $0.30B / $0.16B | 4.06% / 4.65% / — | Revolver capacity $6.6B (October 2028 / October 2030); liquidity $6.9B |
| Sandals bridge (committed, unfunded) | $3.0B | SOFR + 112.5 bp (364-day) | Funds at close (early 2027); must be termed out |
Maturity and commitment schedule
| Year | Debt Maturing | Ship Payments | Total Call on Cash | vs. ~$6.5–7B Operating Cash Flow |
|---|---|---|---|---|
| Rest of 2026 | $0.86B | $0.33B | $1.19B | Comfortable |
| 2027 | $2.70B | $2.46B | $5.16B (+$3B Sandals) | Tight with Sandals |
| 2028 | $3.45B | $4.59B | $8.04B | Exceeds operating cash flow — refinancing-dependent |
| 2029 | $1.22B | $3.63B | $4.85B | Manageable |
| 2030 | $1.32B | — | $1.32B | Comfortable |
| Thereafter | $13.86B |
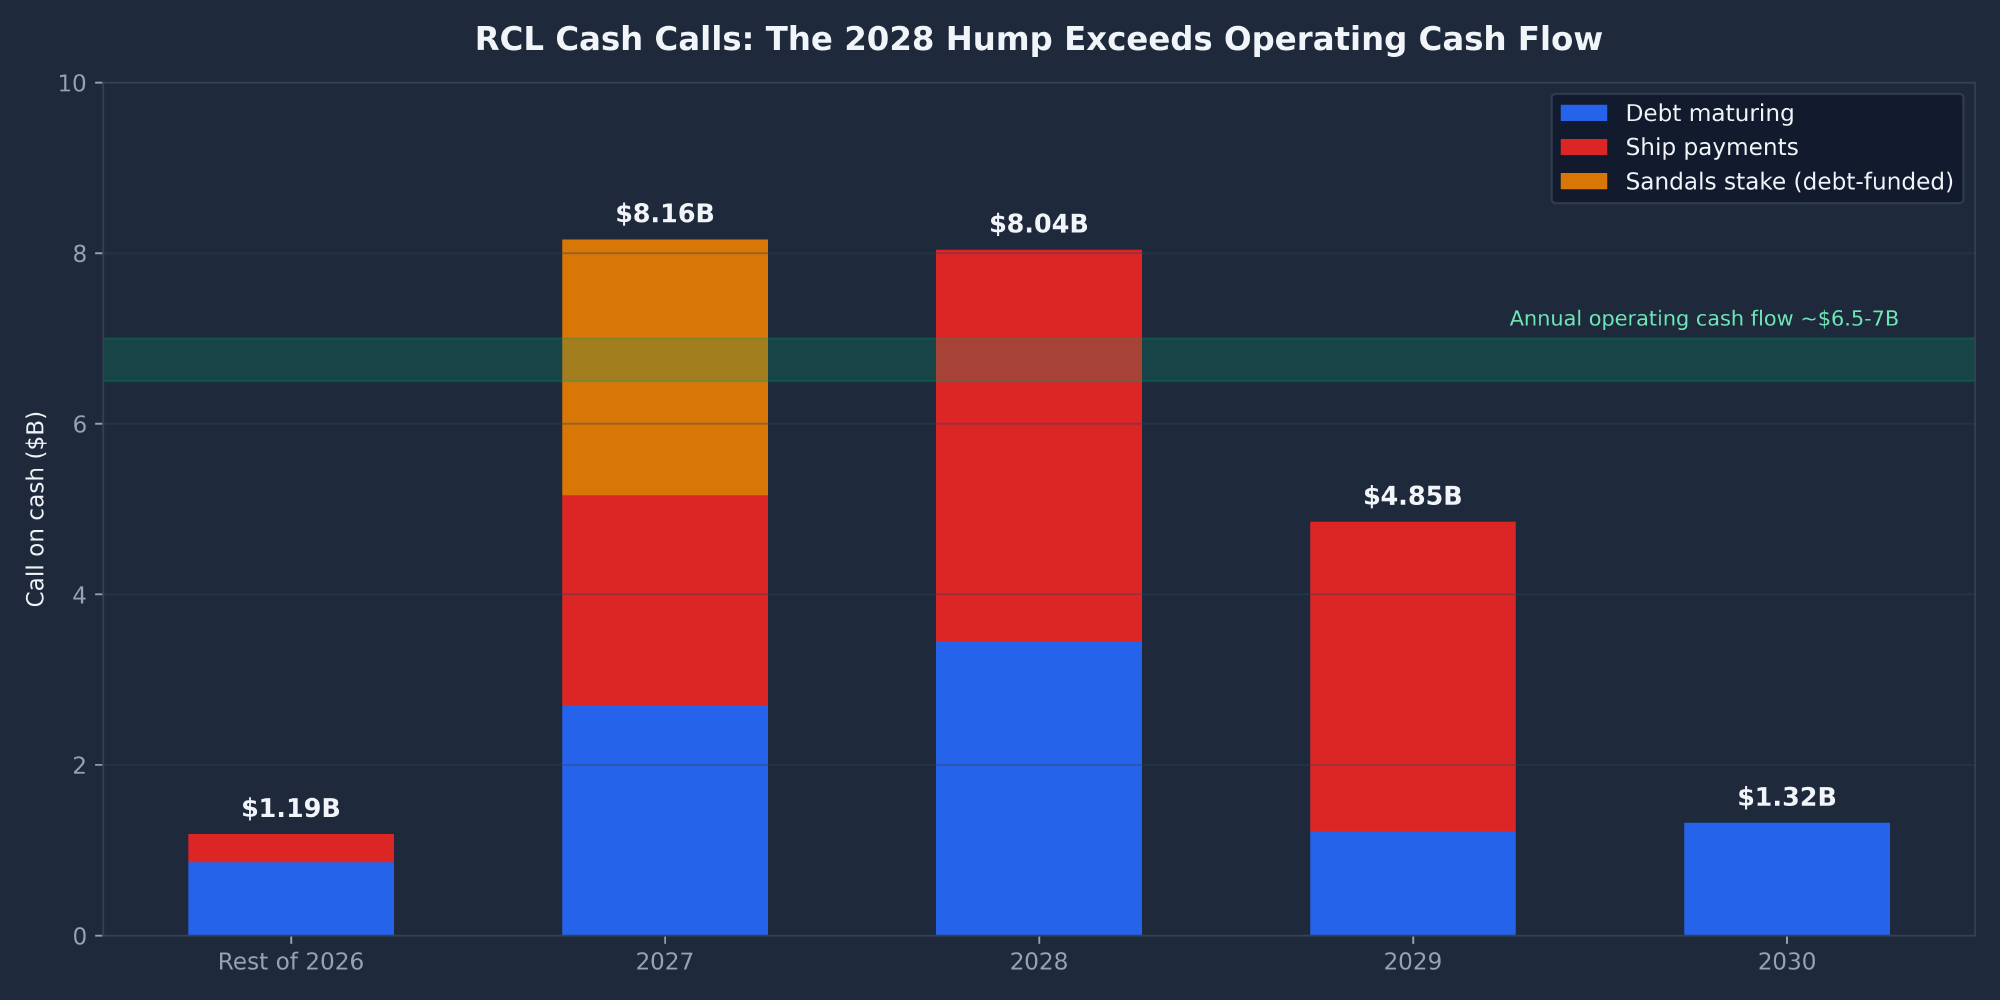
Not a debt cliff — but a 2028 hump. Only ~15% of total debt matures within 18 months, below the 25% level I treat as a cliff. The pressure point is 2028, when $3.45 billion of maturities collide with $4.59 billion of ship deliveries (Icon 5, Oasis 7, Celebrity Xcite).
The order book grew from $11.3 billion (YE25) to $16.5 billion (June 30, 2026), 52.6% euro-denominated — a 10% stronger euro adds ~$727 million. Ship loans are pricing at SOFR + 0.80–0.90% with upfront guarantee fees of 2.35–5.48%.
Management and Governance Timeline
| Date | Event | Stock Context |
|---|---|---|
| Nov 2021 (effective Jan 3, 2022) | Fain → Liberty as CEO ($1.2M salary, 200% bonus, $7M long-term incentive); Holtz becomes CFO | ~$75; 2022 low of $31 (July) |
| 2022 | Say-on-pay support only 79% (subsequently 97–98%); Leavitt joins the board | |
| Apr 2023 | Lutoff-Perlo moves to Vice Chair, External Affairs; Hodges Bethge runs Celebrity | ~$90 |
| 2023–2026 | Board adds Yeung (2023), Wiernicki (2026) and Bunch (2026); Reilly retires | |
| Jun 2025 | Fain to step down as Chair (Q4 2025); Liberty becomes Chairman & CEO; John Brock named Lead Independent Director | ~$300 (near the ATH) |
| Feb 2026 | 2023–25 PSUs vest at 298% of target (Liberty 275,686 shares; Bayley 167,810; Holtz 60,411); the same week, 7 insiders sell $627M | $311–332 |
| Succession watch | Bayley (67) and Kulovaara (73) — two key operators near retirement |
Compensation — the biggest governance flag
| Metric | 2022 | 2023 | 2024 | 2025 |
|---|---|---|---|---|
| CEO pay (Summary Compensation Table) | $10.8M | $17.2M | $19.5M | $24.0M |
| CEO “compensation actually paid” | $3.8M | $44.2M | $76.6M | $49.0M |
| PSU EPS target vs. actual | — | $3.30 vs. $7.13 | $5.97 vs. $11.80 | $8.23 vs. $15.64 |
| Annual bonus EPS target (max) | — | — | — | $14.50 ($15.52) vs. $15.64 → paid at max |
The 2025 PSU EPS target ($8.23) sat below the public Trifecta floor of $10, and the ROIC target (11.2%) sat below the public 13% goal. Every financial metric paid 200% in every year, plus a 100% “Trifecta kicker” — 298% overall. The CEO pay ratio is 1,260:1.
In fairness, five-year TSR turned $100 into $380 versus $152 for the peer index, and say-on-pay has run ~97% since 2023. Insiders other than the Wilhelmsen family own only ~0.83M shares (~0.3%). Liberty earned 275,686 PSU shares for 2023–25 but held 169,595 shares in April 2026.
Other governance notes: an Ofer-affiliated company chartered a ship for $4.2 million (June 2025, related party). PwC has been the auditor throughout (fees $6.71 million in 2025 vs. $5.50 million), with no auditor change. Liberty is required to fly charter for personal travel following a security study.
Risk Factor Evolution
| 10-K | Section Size | New / Intensified | Removed / Diminished |
|---|---|---|---|
| FY2021 | 82.7K characters | ↑ COVID, liquidity, covenant waivers, dilution, “no dividends” | — |
| FY2022 | 71.1K | ★ “May not achieve fiscal 2025 financial and climate goals” (Trifecta); ★ climate regulation; ↑ inflation, fuel, Ukraine | ↓ Standalone COVID risk |
| FY2023 | 67.8K | ★ Shipyard slowdowns; ★ land-based destination projects; ★ dividend policy may change | ↓ “No dividends,” LIBOR, “may incur more debt” |
| FY2024 | 58.9K | ★ UK tonnage tax; ★ global minimum tax “may materially impact us starting in 2026” | ↓ Substantial debt, restrictive covenants, convertible dilution, fiscal-2025 goals (achieved) |
| FY2025 | 61.3K | ★ AI (distribution disruption); ★ data privacy; ↑ foreign political/regulatory risk on land projects; ★ “no assurance of dividends or buybacks at historical levels”; ★ tariffs | ↓ Global minimum tax softened to “not expected to be material” (most ships moved into UK tonnage tax from 2026) |
| 2026 10-Qs | — | “No material changes” — despite SEMARNAT, the Havana Docks remand, Iran/Hormuz and the Sandals deal |
The arc is clear: survival risks have been removed, and execution and expansion risks added. Two choices stand out. The “substantial indebtedness” risk factor was deleted in FY2024 — just before debt started rising again. And the FY2025 10-K added a caveat that dividends and buybacks may not continue at historical levels, the first such hedge since reinstatement.
Hidden Gems and Red Flags
Hidden Gems
- A $6.74B interest-free float. Customer deposits grew every year since 2020 and hit $6.74B in June 2026 (55% non-refundable) — ~29% of total debt, funded by guests. (June is the seasonal peak; year-end deposits grew 4.4% in 2025 vs. 5.5% capacity.)
- A ~2% tax rate, quietly protected. $82M of tax on $4.37B pre-tax (Liberian shipping exemption ~$850M, U.S. §883 ~$200M, UK tonnage tax ~$94M). Moving most ships into UK tonnage tax from 2026 neutralized the global-minimum-tax risk flagged a year earlier.
- The TUI JV is maturing into a cash cow. JV net income of $805M (2025); $414M of equity income; a first large $258M dividend.
- Conservative depreciation. 30–35-year ship lives with 10–15% residual value. One less year of life = $157M, and zero residual = $470M of hidden earnings cushion. No impairments in 2024–25.
- Fuel hedged below market. 2026: 58% @ $474/mt; 2027: 53% @ $405; 2028: 29% @ $424.
- Carbon / ETS immaterial for 2026. More than 70% of the fleet has scrubbers, 50% is shore-power capable, and carbon intensity fell 15.1% in 2025.
Red Flags
- Havana Docks is live again — unreserved. $112M judgment → $130M charge (2022) → 11th Circuit reversal → RCL released $124M (flattering 2024) → the Supreme Court vacated the reversal on May 21, 2026. No new reserve; treble damages possible.
- Perfect Day Mexico permit. $294M paid for Costa Maya plus a $137M deferred tax liability; SEMARNAT says it will deny the permit; Q2 filings are silent. Re-scope or impairment possible. The Labadee (Haiti) closure was extended.
- Sandals returns below RCL’s ROIC. ~10× forward EBITDA for a non-consolidated 50% stake; an estimated ~10% pre-depreciation return vs. 18% ROIC; ~3.5× pro-forma leverage, one notch above the swap-collateral trigger. RCL’s own 10-K lists all-inclusive resorts as competitors.
- Shareholder returns exceed free cash flow. 2025 FCF of $1.24B vs. $1.98B returned; 1H26 ~$0.46B vs. ~$1.7B. Buybacks at ~$286–288 (2025–Q1 2026) and $249.60 (May 2026).
- Compensation targets below public goals — a 298% PSU payout.
- Q2 2026 softness. EPS −3.9%, adjusted EBITDA/APCD −5.7%; Q3 yields guided flat.
- Lease and insurance gaps. The PortMiami Terminal G lease steps up to ~$55M a year from 2027; the HQ lease runs to 2077; $1.41B of operating leases plus $1.75B of other commitments. No business-interruption insurance on ships, and war-risk cover is cancellable on 7 days’ notice.
- Stock comp swings with the stock ($126M → $267M → $175M), which drove the 2023–24 unit-cost misses.
Capital Allocation Track Record
| $M | 2021 | 2022 | 2023 | 2024 | 2025 | 1H26 |
|---|---|---|---|---|---|---|
| Operating cash flow | (1,878) | 481 | 4,477 | 5,265 | 6,465 | 3,694 |
| CapEx (% of revenue) | 2,230 (146%) | 2,710 (31%) | 3,897 (28%) | 3,268 (20%) | 5,229 (29%) | 3,237 (35%) |
| Free cash flow | (4,108) | (2,229) | 580 | 1,997 | 1,236 | 457 |
| Dividends | 0 | 0 | 0 | 107 | 824 | ~676 |
| Buybacks | 0 | 0 | 0 | 0 | 1,159 | 1,035 |
| Net debt change | +1,419 | +1,757 | −2,199 | −1,758 | +1,017 | ~+1,500 |
Dividend: reinstated at $0.40/quarter (July 2024) → $0.55 → $0.75 → $1.00 → $1.50 (2026) = $6.00 a year, ~34% of 2026 EPS. Buybacks: a $1 billion program (February 2025) was completed by November; the $2 billion program (December 2025) has $805 million remaining.
Land bets: CocoCay/Hideaway, Paradise Island, Costa Maya ($294 million), Cozumel, Santorini, Lelepa, Cormorant, a 10% iCON port stake, Celebrity River (20 ships by 2031), and now Sandals ($3 billion). Non-ship capex rose from $0.5 billion (2023) to $1.6–1.8 billion (2026).
Assessment: 2022–24 was disciplined deleveraging. Since 2025, cash is split three ways — ships, land/M&A and shareholder returns — and the sum exceeds free cash flow, so leverage is drifting back up. Buybacks have been executed near the top of the range (~$287 average), which has not created value so far. Investing for growth and paying out at the same time only works if yields keep rising.
Competitive Position
| Factor | Evidence from Filings |
|---|---|
| Named competitors | Carnival (AIDA, Costa, Cunard, Holland America, P&O, Princess, Seabourn), Disney, MSC, NCLH (Norwegian, Oceania, Regent), Viking, Virgin — plus land vacations including all-inclusive resorts |
| Market share | A stable ~24% of global berths: 24.5% (2019), 24.2% (2023), 24.1% (2025; 174,600 of 725,000). ~25% of the industry’s 37M guests. |
| Growth vs. industry | RCL capacity +4–7% a year vs. an industry order book of ~3% a year (47 ships / 113K berths through 2029) |
| Penetration runway | 5.96% of North Americans cruised in 2025 (3.89% in 2019); Europe 1.73%; Asia-Pacific 0.09% |
| Moats | (1) Newest, largest ships (Icon class) earn premium yields; (2) private destinations (CocoCay, Royal Beach Clubs); (3) scale — flat unit costs on +5.5% capacity; (4) 28M loyalty members, the Royal ONE card, ~90% digital pre-cruise sales; (5) an investment-grade cost of capital with export-credit ship financing at SOFR + 0.80–0.85% |
| Strategic drift | The “$2 trillion vacation market” push (river cruising, resorts, hotels) widens the addressable market but dilutes a focused, high-return cruise model. |
SEC Filings Bottom Line
What the filings tell us that the headlines don’t: RCL’s recovery is real and was earned. On paper it is the best-executed turnaround in travel: every Trifecta target hit 18 months early, debt transformed from 11.6% secured paper to 4.66% unsecured investment grade, record 39% EBITDA margins and an 18% ROIC, and 16 consecutive quarters above the top of guidance. Customer deposits and the tax structure are underappreciated assets.
Is management credible? Yes on near-term financial guidance — the most reliable in the sector. Less so on land-destination timelines (Puerto Williams, Cozumel, Mexico) and on incentive design: performance targets set below the company’s own public goals produced a 298% payout and a $76.6 million “actually paid” CEO year.
Hidden risks: three things the 10-Qs barely mention — the revived Havana Docks claim (no reserve after a $124 million release), the Perfect Day Mexico permit, and the swap-collateral trigger sitting right at RCL’s current rating. And one big new commitment: a debt-funded $3 billion resort stake on top of a $16.5 billion order book, with 2028 cash calls of ~$8 billion.
News & Catalysts
I logged and read 100 articles (from 543 headlines scanned) plus 50 items from a market-news feed, covering September 10 – October 10, 2026. Barron’s, Bloomberg, the FT, Seeking Alpha, Morningstar and Travel Weekly items are paywalled; summaries of those draw on corroborating coverage.
| Price | Articles Logged | Window | Tone | Next Catalyst |
|---|---|---|---|---|
| $282.26 | 100 opened and logged (543 headlines scanned) + 50 from a market-news feed | Sep 10 – Oct 10, 2026 | 47 bullish · 37 neutral · 16 bearish | Q3 earnings Tue Oct 27, 10 a.m. ET |
News Pulse
- Coverage is well above normal. The Sandals deal made RCL a general-business story (Reuters, FT, CNBC, Bloomberg, Forbes, Barron’s) for the first time since COVID; 48 of 100 articles are M&A or analyst-rating stories.
- The narrative flipped in 10 days: from “What the Heck Are They Thinking?” (Barron’s, Sep 23) and “Plummets 12%” (Forbes) to “a quality business on sale” (BofA, Sep 28) and “a standout within an already buoyant industry” (Jefferies, Oct 8).
- Fuel vs. demand is the macro frame. Brent spiked in September, but Carnival’s record Q3 and record 2027 bookings (Sep 29) reassured on demand.
- Capital allocation is the contrarian thread. 24/7 Wall St. (“Earned $4.4 Billion and Its Free Cash Flow Was Negative. Where Did It Go?”) and Insider Monkey ask whether cash should have gone to debt paydown.
- Operational noise is minor: hurricanes, Labadee still closed, a stricter cancellation policy, refund backlash — none of it material.
Key Royal Caribbean News Stories
| Story | Why It Matters | Sentiment |
|---|---|---|
| Royal Caribbean Group and Sandals Resorts Announce Landmark Partnership PR Newswire / 8-K · Sep 23 | 50% of Sandals & Beaches for ~$3B (~$6B valuation, ~10× forward EBITDA), funded by committed Morgan Stanley debt, closing early 2027, “accretive to 2027 earnings.” The JV board is co-led by Adam Stewart and Jason Liberty. The FT broke the talks the day before. Liberty: “an important next step on that journey.” | Neutral |
| Royal Caribbean Is Buying Half of Sandals. ‘What the Heck Are They Thinking?’ Barron’s · Sep 23 | Captured the first-day reaction: a cruise line buying a hotel company, with debt, two years after deleveraging. Forbes reported a ~12% two-day fall; the actual moves were −6.1% and −2.0% close-to-close and −15% high-to-low, to a $222.22 intraday low. | Bearish |
| Royal Caribbean is “a quality business on sale” — BofA upgrade to Buy, $330 Seeking Alpha / MT Newswires · Sep 28 | Andrew Didora: “ROIC in the high teens, EBITDA margins of nearly 40%… over 50% hedged on 2027… Sandals can generate outsized EBITDA growth.” Sees Q4 net yield growth of at least 4%, “the strongest in the cruise industry”; cruise spend up mid-teens in July–August. | Bullish |
| Deutsche Bank Upgrades Royal Caribbean to Buy, $299 MT Newswires · Sep 28 | Chris Woronka: the 26% decline since early August “provides considerably more favorable risk/reward from current levels.” A valuation call, not a thesis change. | Bullish |
| Cruise Stocks Rally as Carnival’s Q3 Results Land 24/7 Wall St. · Sep 29 | Carnival: record revenue, a raised outlook and record 2027 bookings; CEO Josh Weinstein says vacations are “sacrosanct.” CCL +12%, RCL +7.5% — the single biggest up day of the rebound came from a competitor’s print. | Bullish |
| Morgan Stanley Selling Pieces of $3 Billion Royal Caribbean Loan (Exclusive) Bloomberg · Oct 7 | The 364-day bridge priced at SOFR + 112.5 bp is being syndicated, to be refinanced with bonds. Confirms the deal is 100% debt-funded; the stock fell 2.2% that day. | Neutral |
| Royal Caribbean to rally after agreeing to take 50% stake in Sandals, Jefferies says CNBC · Oct 8 | Jefferies upgrades to Buy, $305 → $330; its 2027 net-yield estimate rises from 2.9% to 3.3%; “best buy” into earnings. Yet the stock closed down on the day — upgrade fatigue. | Bullish |
| Royal Caribbean Earned $4.4 Billion and Its Free Cash Flow Was Negative. Where Did It Go? 24/7 Wall St. · Oct 5 | TTM operating cash flow of $6.79B vs. ~$8B of ship capex; levered free cash flow about −$1.5B — while the dividend rose 50%. The cleanest bear framing in the mainstream press. Correction: per Finviz/SEC data, TTM capex was $7.2B and free cash flow −$0.42B; the article appears to use a different capex definition. | Bearish |
| Sandals to earn about US$600m a year, Royal Caribbean deal implies Jamaica Gleaner · Sep 25 | The 10× multiple implies ~$600M of Sandals EBITDA (~$300M attributable to RCL), ~20 resorts and ~6,395 rooms (Barclays). A useful sizing anchor: ~4% of RCL’s EBITDA for ~4% of its market cap. | Neutral |
| Royal Caribbean has no timeline for return to Labadee, says Bayley Travelweek · Oct 6 | “It’s been a lot more violent and a lot more dangerous.” Haiti’s private destination stays closed through at least June 2027 — a modest headwind while Perfect Day Mexico’s permit is also in doubt. | Bearish |
RCL Analyst Ratings and Price Targets
| Date | Firm | Action | Rating | Target |
|---|---|---|---|---|
| Oct 8, 2026 | Jefferies | Upgrade | Hold → Buy | $330 |
| Sep 28, 2026 | Deutsche Bank | Upgrade | Hold → Buy | $299 (Finviz lists $330) |
| Sep 28, 2026 | BofA Securities | Upgrade | Neutral → Buy | $330 |
| Jul 8, 2026 | BMO Capital | Initiated | Outperform | $370 |
| Jun 1, 2026 | Loop Capital | Initiated | Hold | $304 |
| Apr 22, 2026 | BofA | Price target cut (fuel) | Neutral | $330 → $310 |
| Jul 22, 2025 | TD Cowen | Initiated | Buy | $405 |
| Jul 21, 2025 | Truist | Downgrade | Buy → Hold | $337 |
| Apr 25, 2025 | Northcoast | Initiated | Buy | $279 |
| Mar 31, 2025 | Jefferies | Initiated | Hold | $230 |
| Mar 27, 2025 | Exane BNP Paribas | Initiated | Outperform | $262 |
| Nov 26, 2024 | Bernstein | Initiated | Outperform | $290 |
Consensus: Recom 1.62 (Buy) with a mean target of $354.69 (+25.7%). The September and October upgrades landed at $299–$330 (+6% to +17%). JPMorgan raised to $394, Citi is at $362, Barclays trimmed to $337, Northcoast cut to $335 from $368, Truist stays at Hold with $298, and Tigress Financial has the Street-high $425. The FactSet mean is about $351.
The new targets sit below the consensus mean. That suggests the upgraders are buying the dip rather than raising long-term numbers.
Full News Timeline (Most Recent First)
Other headlines in the window: smart glasses added to the restricted-items list; Celebrity raised gratuities (a small yield positive); MarketBeat’s “Traders Buy High Volume of Royal Caribbean Put Options” (Oct 8); a 24-hour maintenance delay on Icon of the Seas (Sep 26); Bank of America’s 13F added 1.01 million shares (Sep 17); and the Celebrity Compass river ship was floated out (Sep 14–15).
Earlier context: Royal Caribbean Raises Full-Year Guidance (Motley Fool, Jul 29); Why Is RCL Down 10.4% Since Last Earnings Report? (Zacks, Aug 27: payroll +23.1%, fuel +27.2%); $90 Crude Now Changes The Math (Benzinga, Apr 22: BofA cut its target to $310); Hormuz Open: Crude Plunges 14%, Cruise Stocks Soar (Benzinga, Apr 17).
News by Category
| Category | Articles | Most Notable |
|---|---|---|
| M&A / Financing | 24 | Sandals 50% stake (press release, Sep 23); Bloomberg loan-syndication exclusive (Oct 7) |
| Analyst Rating | 24 | BofA, Deutsche and Jefferies upgrades; JPMorgan target to $394; Tigress $425 Street-high |
| Product / Technology | 12 | Hero of the Seas debut moved up to August 1, 2027; 5th Icon keel laid; Royal ONE credit card |
| Industry / Sector | 9 | Carnival record Q3 (Sep 29); Elliott’s activist stake in NCLH (Oct 7) |
| Other (consumer, operations, infrastructure) | 9 | Galveston 5th-terminal talks; refund-policy backlash; Serenade Alaska cancellation |
| Opinion / Editorial | 6 | Simply Wall St “45% below fair value”; GuruFocus “overvalued”; 24/7 negative FCF |
| Macro / Market | 6 | Zacks fuel-hedge piece ($1.34B 2026 fuel bill) |
| Earnings | 5 | Q3 call set for Oct 27; consensus $6.36 (+10.6%) |
| Regulatory / Legal | 4 | Labadee closure; Tracy Arm ban extended; passenger-death suit settled |
| Insider / Ownership | 1 | Capital Research 13G/A: 17.1M shares (halved) |
Source Coverage
| Tier | Publications (article count) |
|---|---|
| Tier-1 financial / general | Barron’s (4), CNBC (2), Forbes (2), Reuters (1), Financial Times (1, broke the talks), Bloomberg (1, exclusive), MarketWatch (1), Morningstar (1), Investopedia (1) |
| Financial aggregators / retail | 24/7 Wall St. (7), Investing.com (5), MT Newswires (5), Stocktwits (4), Seeking Alpha (3), Barchart (3), Zacks (3), Yahoo Finance (3), Simply Wall St (2), TradingView (2), TheStreet (2), Benzinga (2), MarketBeat (2), StockStory (2), GuruFocus (1) |
| Travel trade / consumer | TheTravel (5), Cruise Critic (3), Travel Weekly (3, including an exclusive Stewart/Liberty interview), Travel Market Report (2), Royal Caribbean Blog (2), CruiseMapper, Travelweek, PAX News, Cruise Law News, Cruzely |
| Regional / Caribbean | Jamaica Gleaner, Houston Chronicle, Galveston County Daily News, Orlando Sentinel, South Florida Business Journal, The Maritime Executive |
Narrative Analysis
The dominant media narrative is a two-act play. Act one (Sep 22–24) was skepticism: Barron’s, Forbes, 24/7 Wall St. and StockStory framed Sandals as a debt-funded detour into a different operating model, “accretion quarters away,” at a moment when RCL had just been rewarded for deleveraging.
Act two (Sep 28 onward) was the sell side reframing the deal as an ecosystem and loyalty play — BofA’s “quality business on sale,” Citi’s catalyst watch, JPMorgan’s $394 target, Jefferies’ upgrade — amplified by Carnival’s record print. By October 8 the tone in the financial press was predominantly bullish, and the stock had recovered about 22%.
Contrarian coverage centers on capital allocation and cash: negative trailing free cash flow while the dividend rose 50%, ~$8 billion of ship capex, the Sandals return profile, and GuruFocus’ “overvalued” flag. Travel-trade coverage is quietly mixed — stricter cancellation penalties, refund backlash, canceled 2027 sailings, Labadee and Cozumel delays — which echoes the softening-promotion signals in the consumer subreddits.
Media vs. social sentiment: the press (47% bullish) is more bullish than X (~60/40, but with heavy put buying) and Reddit (quiet, ~55/45). Media follows the sell side; the options market is hedging into the print. That gap typically resolves at earnings.
Upcoming Catalysts
| Date | Event | Source | Potential Impact |
|---|---|---|---|
| Oct 11, 2026 | Stricter North American cancellation policy (25% tier removed; straight to 50%) | Travel Market Report | Small yield positive |
| Oct 27, 2026 | Q3 2026 earnings and call (10 a.m. ET) | Company press release | Uncertain — the swing event |
| Nov 2026 | Analyst / investor day (possible new multi-year targets) | Citi | Bullish if a Perfecta successor is credible |
| Q4 2026 – early 2027 | Sandals bridge refinanced with bonds | Bloomberg | Uncertain (credit-rating reaction) |
| Early 2027 | Sandals JV closes | 8-K | Uncertain |
| Mid-2027 | Celebrity River ships begin sailing | Cruise Critic | Mildly bullish |
| Jul 2027+ | Earliest Labadee return | Travelweek | Bearish if extended |
| Aug 1, 2027 | Hero of the Seas (4th Icon-class ship) debut, 10 days early | CruiseMapper | Bullish (new-ship yield premium) |
| Q1 / Mar 2028 | Galveston Pier 14 terminal (possible); Naha (Okinawa) terminal | Houston Chronicle; PR Newswire | Mildly bullish |
News Bottom Line
For a month, RCL’s news flow has been about one thing — Sandals — and the coverage swung from alarm to endorsement in under two weeks, pulled along by three upgrades and Carnival’s record quarter. The financial press now leans clearly bullish, sell-side targets cluster at $330–$394, and the operational news is noise.
What the coverage underweights is the cash story: negative trailing free cash flow, a debt-funded deal being syndicated right now, and a growing list of destination delays. The October 27 call is where the press narrative gets tested against numbers. The market will want to hear Q4 yields of at least 4%, a credible 2027 yield outlook, and how management plans to keep leverage investment-grade after Sandals.
Market Sentiment
This section covers Reddit (r/wallstreetbets, r/stocks, r/investing, r/options, r/ValueInvesting, r/Cruise, r/royalcaribbean), X/Twitter over 30 days (with the last 7 days weighted most), and a market-news feed.
| Price | Overall Sentiment | X / Twitter | Chatter Level | |
|---|---|---|---|---|
| $282.26 | CAUTIOUSLY BULLISH (~58/42) | Neutral → mildly bullish (55/45), very quiet | Cautiously bullish (60/40), heavy put hedging | MODERATE on X (spiked Sep 22–23), LOW on Reddit |
Dominant Catalysts: What Everyone Is Talking About
| # | Catalyst | Why It Matters |
|---|---|---|
| 1 | The $3B Sandals Resorts deal (50% stake, announced Sep 22–23) | About 70% of the month’s high-engagement content. Debt-funded via a 364-day Morgan Stanley bridge loan (SOFR + 112.5 bp). The stock fell 6.1% on the leak and hit a $222 intraday low the next day (−8% close-to-close over two days; −15% high-to-low). The debate: “a cheap land extension that captures more of the vacation wallet” vs. “diworsification into hard assets.” Close expected early 2027. |
| 2 | Oil / Iran / Strait of Hormuz | The single biggest macro swing factor in every thread. Brent spiked to ~$108 in September. Retail frames RCL as an “oil-inverse” trade: “It will go where oil goes… will rocket back to 300 if oil goes back down to 70-80.” |
| 3 | The V-shaped rebound + sell-side upgrades into Q3 earnings (Oct 27) | BofA, Deutsche Bank and Jefferies all moved to Buy (targets clustered at $330) within two weeks of the low; Carnival’s record Q3 (Sep 29) lifted the whole group. RCL had its best week since January 2025 (+14.4%). Now the debate is “bottom or bear-market rally?” |
The Bull Case From the Crowd
| Argument | Representative Quote / Evidence | Source |
|---|---|---|
| Best-in-class cruise operator | “RCL is way better” / “if you want a successful cruise line look at the 5 year of rcl” — in otherwise-bearish CCL threads | r/wallstreetbets |
| Sandals is cheap and strategic | $3B for 50% of 20 all-inclusive resorts ≈ the cost of 1.5 Icon-class ships; land packages, cross-brand loyalty, Caribbean political and port clout. “Cruises are basically all-inclusive resorts that move. Royal can now sell both.” | @LIGregC, @adampnathan |
| Wallet-share moat | “Royal can now keep more of the same customer’s vacation spending instead of losing them when they want a resort instead of a cruise.” | r/ValueInvesting DD |
| The sell side capitulated to Buy | BofA (Neutral → Buy, $330), Deutsche (Hold → Buy, $299; Finviz shows $330), Jefferies (Hold → Buy, $305 → $330, “best buy” into earnings; sees a “more favorable net yield setup for fiscal 2027”), Citi positive catalyst watch | @1rabbitresearch, @insidercruises |
| Washed-out positioning | Record accumulation volume at the lows; a put whale closed $250 and $220 puts for profit; $600K of $300 March 2027 calls bought on the dip day; short calls bought back before the +14% week | @OptionRunners, @FlowbyBobby |
| Industry pricing power | “13th straight quarter of record pricing… 2027 is already half-booked at record prices” (CCL read-through); “They can increase the ticket prices with 20% and still be fully occupied.” | r/NemoMoney, r/wallstreetbets |
| Macro optionality | “Up ~30% in under two weeks, and oil hasn’t even dropped yet.” Rate cuts = the “Warsh Playbook” travel basket. | @thisisorlando, r/stocks |
| Balance-sheet transformation | “During COVID $RCL was raising debt at 11% secured by 28 ships. Now it pays $3B for Sandals... how times change” (111K views) | @junkbondinvest |
The Bear Case From the Crowd
| Argument | Representative Quote / Evidence | Source |
|---|---|---|
| Diworsification | “Diworsification of an already difficult industry... Owning travel assets bad” (prefers BKNG, MAR, HLT); a kid-free resort brand doesn’t fit a family cruise line | @SayNoToTrading |
| Debt-funded, not accretive on day one | “~10x forward EBITDA… funded with debt… about $167M of yearly interest… I do not see much value creation on day one.” “Pro forma net debt is about $25.5B, with large ship commitments still ahead.” | r/ValueInvesting DD |
| No margin of safety at $280 | “The DCF can say $280 and still leave a thin cushion.” The stock is now at that number. | r/ValueInvesting |
| Fuel / Iran exposure | “There is no world where the disruption in oil supply and price doesn’t crush this stock… This fat pig is headed for slaughter.” (893 upvotes, March); Brent $108 in September | r/wallstreetbets |
| Early demand-softness tells | “the recent 2x points offers on Royal and Celebrity were the first teeny hint in years that bookings are weaker”; “7 nights balcony for $1k… cheapest I have seen with Royal”; repricing threads; unprecedented free-cruise casino mailers (“…recession indicator”) | r/Cruise, r/royalcaribbean |
| Brand erosion / cost-cutting | “RC is cutting food budget to the max”; “I’m Diamond Plus with 350+ cruise nights and I’ve almost completely left Royal” (139 upvotes / 358 comments) | r/royalcaribbean |
| Heavy hedging into earnings | $250 puts (Oct 9), a December 270/250 put spread, $130 June 2027 tail puts, a “$20M bet against global travel”; macro accounts buying January protective puts across cruise, airline and hospitality names | @MoneyPrinter0x, @AIoptionhacker, @BullTradeFinder |
| Smart money exiting | Capital Research Global Investors cut its stake ~50% (34.3M → 17.2M shares, 12.8% → 6.4%) as of Sep 30 | @thinksabio |
| Couldn’t rally on an upgrade | “$RCL -1% even on the Jefferies upgrade... when a fresh Buy can’t lift a cruise name... someone is worried.” | @S_NewsRoomCOM |
Reddit Breakdown
| Subreddit | Activity | RCL Posts (~3 months) | Tone |
|---|---|---|---|
| r/wallstreetbets | LOW | 0 dedicated (RCL only inside CCL threads) | Bearish on CCL; RCL called “way better” |
| r/stocks | LOW | 1 | Mildly bullish (“290-300 should be retaken… 330 is doable”) |
| r/investing | NONE | 0 | — |
| r/options | NONE | 0 | — |
| r/ValueInvesting | LOW | 1 DD + 1 oil-short thesis | Neutral/cautious — fair value ~$280, thin cushion |
| r/Cruise / r/royalcaribbean | HIGH (consumer) | Many | Loyal but complaining: cost-cutting, discounting, repricing |
Top Reddit Posts
| Post | Subreddit | Upvotes | Comments | Date |
|---|---|---|---|---|
| The Cruise Industry is going to get BURIED… 10k Puts | WSB | 893 | 221 | 2026-03-19 |
| Weekly Earnings Thread 7/27–7/31 (RCL Q2 week) | WSB | 280 | 1.2K | 2026-07-26 |
| CCL can’t catch a break | WSB | 209 | 177 | 2026-09-20 |
| What has happened to RC | r/royalcaribbean | 139 | 358 | 2026-09-21 |
| The Warsh Playbook | r/stocks | 133 | 109 | 2026-04 |
| Royal Caribbean reportedly close to buying a stake in Sandals | r/Cruise | 98 | 32 | 2026-09-22 |
| Check Your Prices!! (fare drops) | r/royalcaribbean | 93 | 63 | 2026-10-03 |
| Sold at the bottom | WSB | 63 | 35 | 2026-09-04 |
| One week of offers (casino mailers) | r/royalcaribbean | 54 | 57 | 2026-10-06 |
| Up 300% on Carnival earnings | r/smallstreetbets | 27 | 21 | 2026-09-29 |
| Merch Musings… & $RCL Add | r/InnerCircleInvesting | 12 | 4 | 2026-09-24 |
| RCL at ~$230: Sandals widens the moat, but the deal isn’t cheap (DD) | r/ValueInvesting | 2 | 6 | 2026-09-24 |
Twitter / X Key Voices
| Account | Date | Summary | Likes / Views | Tone |
|---|---|---|---|---|
| @keenanfalconer | Sep 22 | Scoop: RCL in talks for Sandals at a $6B valuation | 188 / 80K | News |
| @RoyalCaribbean | Sep 23 | Official “landmark partnership” with Sandals/Beaches; close early 2027 | 222 / 20K | Company |
| @junkbondinvest | Sep 23 | From 11% ship-secured COVID debt to $3B of M&A | 132 / 111K | Admiring |
| @wallstengine | Sep 22 | “$RCL nears $6B+ Sandals acquisition, its biggest deal ever” | 123 / 54K | News |
| @CNBC | Sep 22 | RCL nears $3B deal for a 50% stake in Sandals | 76 / 66K | News |
| @Forbes | Sep 23 | “Royal Caribbean Stock Plummets 12% Following $3B Deal With Sandals” | 41 / 42K | Bearish |
| @MoneyPrinter0x | Oct 6 | Buying January protective puts on cruises, airlines and hospitality; warns of 2019-repo-style stress | 187 / 26K | Bearish hedge |
| @business (Bloomberg) | Oct 7 | Morgan Stanley syndicating the $3B Sandals bridge loan | 65 / 31K | News |
| @JowiPozoX | Sep 17 | “8 high-quality stocks in decline” — RCL #6 | 74 / 15K | Bullish |
| @KrisPatel99 | Sep 22 | “Huge growth driver for $RCL... monetization engine is running” | 33 / 14K | Bullish |
| @SayNoToTrading | Sep 22 | “Diworsification of an already difficult industry” | 23 / 7.3K | Bearish |
| @PatrickCiummoCS (Schwab Network) | Oct 6 | “Sailed right back to its 200-DMA... reference point into earnings 10/27” | 6 / 251 | Technical |
| @AIoptionhacker (Andrew Keene) | Oct 7 | $130 June 2027 puts bought (a 54% out-of-the-money tail hedge) | — | Bearish flow |
| @BullTradeFinder | Oct 9 | “$RCL MASSIVE FLOW $250 PUTS. SHORT LOOKS GOOD TOO ON THE CHART” | 6 / 5.0K | Bearish |
| @insidercruises | Oct 10 | Jefferies calls RCL its “best buy” into October 27 earnings | — | Bullish |
Signal hygiene: about 80% of raw “$RCL” results over the last 48 hours on X were a coordinated spam ring (“I made $80,000 following…”, WhatsApp “advisors”), and “#RCL” is dominated by RC Lens football, a cricket league and crypto. All of that was excluded.
Recent Headlines From the Market-News Feed
Sentiment Timeline of Key Events
| Date | Event | Stock Impact |
|---|---|---|
| Mar 2026 | Iran conflict / Hormuz closure; the WSB “BURIED” puts thesis goes viral | $356 → $256 |
| Apr 17, 2026 | Hormuz reopens; crude −14% | +7.3% close (+10% intraday) |
| Jul 28, 2026 | Q2 beat; full-year EPS guidance raised; 110% occupancy | +5.7% to $322.50 on the day, then −10% over the following month |
| Aug–Sep 2026 | Brent spikes to ~$108; 17 straight sessions with RSI below 30 | $334 → $250 |
| Sep 22–23, 2026 | FT/CNBC leak, then the official $3B / 50% Sandals deal (debt-funded) | −6.1%, intraday low $222.22 |
| Sep 24–28, 2026 | Citi positive catalyst watch; BofA and Deutsche upgrade to Buy | Reversal |
| Sep 29, 2026 | Carnival record Q3; “2027 half-booked at record prices” | +7.5% |
| Sep 30 – Oct 6, 2026 | Capital Research halves its stake (13G/A); Bloomberg reports the bridge-loan syndication | Rally to $289 (200-day average) |
| Oct 8, 2026 | Jefferies upgrade to Buy ($330) — stock −1% on the news; put buying picks up | Stall at $282 |
| Oct 27, 2026 | Q3 2026 earnings | Next catalyst |
Sentiment Bottom Line
The internet’s view of RCL is cautiously bullish, with the trade now crowded on the hedge side rather than the long side. The crowd agrees RCL is the best operator in cruising, and the September Sandals shock turned into a textbook “sell the rumor, upgrade the dip” rebound — three Buy upgrades clustered at $330 and the best week in 20 months.
But at $282 the stock sits right at the one serious Reddit DCF value (~$280) and right at its 200-day average. The most-cited bull targets (“back to 290-300”) have largely been hit, and the incremental flow into the October 27 print is protective puts.
Two things the crowd isn’t pricing in yet: the bear-side tells from the consumer subreddits — heavier discounting, repricing and casino-mailer blitzes — and whether management can justify a debt-funded resort deal to a market that just finished rewarding it for deleveraging. Expect sentiment to be set by the Q3 call, not the forums.
Insider & Institutional Activity
This section draws on all 265 SEC Form 4, 4/A and 5 filings since October 10, 2021 (every footnote parsed), OpenInsider (310 rows), the 2026 proxy ownership tables, 2026 13G/A filings, 13F manager data, and daily prices for 30/60/90-day forward returns.
| Price | Insider Ownership | Institutional Ownership | 5-Year Open-Market Net | Insider Signal |
|---|---|---|---|---|
| $282.26 | 6.51% (Wilhelmsen 6.1%; all others ~0.3%) | 80.5% | −$1.266B (sold $1.267B, bought $1.0M) | NEUTRAL → LEANING BEARISH |
Insider Activity Summary
- Last 12 months (Oct 2025 – Oct 2026): ~$631M of open-market sales (2.0M shares) by 7 insiders and zero open-market purchases. The last insider buy was CFO Naftali Holtz on August 2, 2024 at $140 — 26 months ago.
- 5 years: 3 open-market buys ($1.0M) vs. 229 sale lines (7.0M shares, $1.267B). The buy/sell ratio by dollars is 0.0008 (0.005 excluding Wilhelmsen).
- Why not outright bearish: ~84% of the dollars sold are the founding Wilhelmsen family’s slow diversification (21.96M → 16.44M shares over five block programs). Executive selling is a predictable February ritual right after performance-share vesting.
- Why leaning bearish: the selling has been well-timed — after the February 2026 cluster ($627M at $311–332) the stock fell 17% in 90 days — and no insider bought the 2026 dip to $222–230. Meanwhile Capital Research Global Investors halved its stake between June 30 and September 30.
Key Insider Trades
| Date | Insider | Type | Shares @ Price | Value | Form 4 Context |
|---|---|---|---|---|---|
| Feb 13–27, 2026 | A.A. Wilhelmsen (Director) via AWILHELMSEN AS | SELL | 1,731,597 @ $311–332 | $549.6M | Indirect (AWILHELMSEN AS 12.4M shares + AWilhelmsen Asset Mgmt 4.04M); not 10b5-1; Form 144 filed for up to 2.0M shares ($639M) |
| Nov 15–21, 2024 | Wilhelmsen | SELL | 1,015,000 @ $229–239 | $237.4M | Indirect; not 10b5-1 |
| Dec 2023 | Wilhelmsen | SELL | ~1.0M @ ~$120 | $120.5M | Indirect; not 10b5-1 |
| Dec 2022 | Wilhelmsen | SELL | 1.42M @ $57–61 | $85.9M | Near the cycle low — the stock is up ~4.7× since (the worst-timed large sale) |
| May 2023 | Wilhelmsen | SELL | 897K @ ~$80 | $71.4M | Indirect; not 10b5-1 |
| Feb 13, 2026 | Jason Liberty (Chairman & CEO) | SELL | 90,910 @ $326.81 | $29.7M | Not 10b5-1; 3 days after a 275,686-share PSU vest (108,481 withheld for tax at $345.41); holds 218,822 after |
| Feb 13, 2026 | Michael Bayley (CEO, RCI) | SELL | 80,000 @ $326.82 | $26.1M | After a 167,809-share vest; sold another $4.05M on July 29, 2026 @ $315.99 (not 10b5-1) |
| Feb 13, 2026 | Naftali Holtz (CFO) | SELL | 51,131 @ $327.39 | $16.7M | After a 60,411-share vest; holds 28,116 after |
| Feb 18, 2025 | Liberty (CEO) | SELL | 58,000 @ $261.95 | $15.2M | Same-day sales by the CEO, CFO, Bayley and Bethge; stock −27.6% 60 days later |
| Feb 2024 – Aug 2025 | Richard Fain (former Chair/CEO) | SELL | 146,082 @ $123–312 | $31.1M | 12 lines, none 10b5-1; GRAT wound up September 2024 (286K shares to heirs); nothing sold since August 6, 2025 |
| Aug 2, 2024 | Naftali Holtz (CFO) | BUY | 5,350 @ $140 | $749K | The best-timed trade in the dataset: +48.6% in 90 days |
| Aug 10, 2023 | Maritza Montiel (Director) | BUY | 1,000 @ $103.70 | $104K | −7.9% at 90 days |
| Jun 9, 2022 | Vagn Sorensen (Director) | BUY | 2,785 @ $53.73 | $150K | −11.3% at 90 days, +425% to today |
Complete Insider Trading Timeline (Open Market)
Most recent first, grouped by quarter. The last column shows whether the trade was under a 10b5-1 plan and the stock’s return 30 / 60 / 90 days later. Excludes routine awards (142 lines), tax withholding (164 lines, $156M) and gifts (8 lines).
| Date | Insider | Title | Type | Shares | Price | Value | Owned After | Plan · 30/60/90d |
|---|---|---|---|---|---|---|---|---|
| 2026 Q3 — sales $4.0M · buys $0.00M · net −$4.0M | ||||||||
| 2026-07-29 | Bayley Michael W | Pres & CEO, Royal Caribbean Intl | SELL | 12,811 | $315.99 | $4.05M | 45,297 | No · −13.7% / −25.0% / n/a |
| 2026 Q1 — sales $626.7M · buys $0.00M · net −$626.7M | ||||||||
| 2026-02-27 | Wilhelmsen Arne Alexander | Director | SELL | 245,476 | $311.54 | $76.48M | 16,435,910 | No · −15.9% / −17.7% / −9.5% |
| 2026-02-26 | Wilhelmsen Arne Alexander | Director | SELL | 356,026 | $318.39 | $113.36M | 16,681,386 | No · −18.1% / −18.8% / −13.7% |
| 2026-02-25 | Wilhelmsen Arne Alexander | Director | SELL | 170,105 | $315.92 | $53.74M | 17,037,412 | No · −16.4% / −17.3% / −14.5% |
| 2026-02-24 | Wilhelmsen Arne Alexander | Director | SELL | 345,111 | $315.73 | $108.96M | 17,207,517 | No · −13.4% / −18.2% / −15.4% |
| 2026-02-23 | Wilhelmsen Arne Alexander | Director | SELL | 19,140 | $317.30 | $6.07M | 17,552,628 | No · −7.8% / −12.2% / −11.5% |
| 2026-02-20 | Wilhelmsen Arne Alexander | Director | SELL | 109,297 | $314.81 | $34.41M | 17,571,768 | No · −11.5% / −13.8% / −17.4% |
| 2026-02-19 | Wilhelmsen Arne Alexander | Director | SELL | 101,902 | $312.09 | $31.80M | 17,681,065 | No · −10.1% / −9.0% / −18.2% |
| 2026-02-18 | Wilhelmsen Arne Alexander | Director | SELL | 104,540 | $321.64 | $33.62M | 17,782,967 | No · −17.3% / −11.5% / −22.5% |
| 2026-02-17 | Wilhelmsen Arne Alexander | Director | SELL | 180,000 | $325.09 | $58.52M | 17,887,507 | No · −16.0% / −12.8% / −22.0% |
| 2026-02-17 | Montiel Maritza Gomez | Director | SELL | 1,385 | $327.18 | $453,137 | 12,849 | No · −16.0% / −12.8% / −22.0% |
| 2026-02-17 | Bethge Laura H | President, Celebrity Cruises | SELL | 7,854 | $326.21 | $2.56M | 32,786 | No · −16.0% / −12.8% / −22.0% |
| 2026-02-13 | Wilhelmsen Arne Alexander | Director | SELL | 100,000 | $326.58 | $32.66M | 18,067,507 | No · −12.1% / −11.9% / −17.0% |
| 2026-02-13 | Pujol Henry L | Chief Accounting Officer | SELL | 4,442 | $327.99 | $1.46M | 10,067 | No · −12.1% / −11.9% / −17.0% |
| 2026-02-13 | Liberty Jason T | President & CEO | SELL | 90,910 | $326.81 | $29.71M | 218,822 | No · −12.1% / −11.9% / −17.0% |
| 2026-02-13 | Holtz Naftali | Chief Financial Officer | SELL | 51,131 | $327.39 | $16.74M | 28,116 | No · −12.1% / −11.9% / −17.0% |
| 2026-02-13 | Bayley Michael W | Pres & CEO, Royal Caribbean Intl | SELL | 80,000 | $326.82 | $26.15M | 58,108 | No · −12.1% / −11.9% / −17.0% |
| 2025 Q4 — sales $0.3M · buys $0.00M · net −$0.3M | ||||||||
| 2025-11-03 | Montiel Maritza Gomez | Director | SELL | 1,100 | $281.76 | $309,936 | 14,234 | No · −4.3% / +2.0% / +20.2% |
| 2025 Q3 — sales $10.1M · buys $0.00M · net −$10.1M | ||||||||
| 2025-08-19 | Sorensen Vagn O | Director | SELL | 10,300 | $330.04 | $3.40M | 16,407 | No · −1.3% / −8.2% / −25.3% |
| 2025-08-06 | Fain Richard D | Director | SELL | 16,000 | $311.02 | $4.98M | 150,291 | No · +12.2% / +1.0% / −18.0% |
| 2025-07-30 | Pujol Henry L | Chief Accounting Officer | SELL | 5,207 | $329.47 | $1.72M | 7,826 | No · +9.7% / −1.3% / −11.5% |
| 2025 Q2 — sales $6.9M · buys $0.00M · net −$6.9M | ||||||||
| 2025-06-27 | Lake Robert Alexander | SVP, CLO, Secretary & CCO | SELL | 2,869 | $299.85 | $860,270 | 21,077 | Yes · +13.7% / +14.3% / +4.9% |
| 2025-06-06 | Lake Robert Alexander | SVP, CLO, Secretary & CCO | SELL | 2,500 | $275.00 | $687,500 | 23,946 | Yes · +19.0% / +12.7% / +30.3% |
| 2025-05-19 | Fain Richard D | Director | SELL | 19,600 | $253.10 | $4.96M | 165,421 | No · +5.4% / +37.8% / +28.6% |
| 2025-05-12 | Montiel Maritza Gomez | Director | SELL | 1,500 | $242.49 | $363,735 | 14,464 | No · +10.6% / +39.8% / +25.1% |
| 2025 Q1 — sales $41.5M · buys $0.00M · net −$41.5M | ||||||||
| 2025-02-18 | Liberty Jason T | President & CEO | SELL | 58,000 | $261.95 | $15.19M | 143,214 | No · −18.0% / −27.6% / −3.0% |
| 2025-02-18 | Holtz Naftali | Chief Financial Officer | SELL | 17,000 | $261.62 | $4.45M | 42,127 | No · −18.0% / −27.6% / −3.0% |
| 2025-02-18 | Bethge Laura H | President, Celebrity Cruises | SELL | 14,992 | $261.86 | $3.93M | 21,155 | No · −18.0% / −27.6% / −3.0% |
| 2025-02-18 | Bayley Michael W | Pres & CEO, Royal Caribbean Intl | SELL | 49,134 | $262.07 | $12.88M | 33,022 | No · −18.0% / −27.6% / −3.0% |
| 2025-02-13 | Fain Richard D | Director | SELL | 19,500 | $256.68 | $5.01M | 185,021 | No · −15.6% / −26.2% / −3.4% |
| 2024 Q4 — sales $252.8M · buys $0.00M · net −$252.8M | ||||||||
| 2024-11-21 | Wilhelmsen Arne Alexander | Director | SELL | 139,353 | $237.89 | $33.15M | 18,167,507 | No · +0.1% / +2.4% / +11.1% |
| 2024-11-20 | Kulovaara Harri U | EVP, Maritime | SELL | 3,256 | $234.62 | $763,923 | 22,348 | No · +1.1% / +3.1% / +11.0% |
| 2024-11-20 | Wilhelmsen Arne Alexander | Director | SELL | 250,000 | $235.45 | $58.86M | 18,306,860 | No · +1.1% / +3.1% / +11.0% |
| 2024-11-19 | Wilhelmsen Arne Alexander | Director | SELL | 230,000 | $233.62 | $53.73M | 18,556,860 | No · −1.7% / +3.7% / +11.6% |
| 2024-11-18 | Wilhelmsen Arne Alexander | Director | SELL | 195,647 | $231.83 | $45.36M | 18,786,860 | No · −1.0% / +4.3% / +13.0% |
| 2024-11-15 | Wilhelmsen Arne Alexander | Director | SELL | 200,000 | $231.64 | $46.33M | 18,982,507 | No · +5.0% / −0.8% / +12.4% |
| 2024-11-05 | Kulovaara Harri U | EVP, Maritime | SELL | 19,385 | $209.58 | $4.06M | 25,604 | No · +19.2% / +8.4% / +23.8% |
| 2024-10-31 | Fain Richard D | Director | SELL | 18,900 | $206.64 | $3.91M | 5,500 | No · +19.4% / +12.8% / +30.4% |
| 2024-10-30 | Pujol Henry L | Chief Accounting Officer | SELL | 6,723 | $208.51 | $1.40M | 9,964 | No · +17.1% / +11.7% / +27.3% |
| 2024-10-30 | Fain Richard D | Director | SELL | 25,000 | $210.02 | $5.25M | 204,521 | No · +17.1% / +11.7% / +27.3% |
| 2024 Q3 — sales $4.5M · buys $0.75M · net −$3.7M | ||||||||
| 2024-08-29 | Bethge Laura H | President, Celebrity Cruises | SELL | 3,073 | $168.71 | $518,446 | 27,388 | Yes · +6.3% / +22.0% / +44.8% |
| 2024-08-15 | Sorensen Vagn O | Director | SELL | 5,800 | $158.50 | $919,300 | 25,837 | No · +5.9% / +22.8% / +46.2% |
| 2024-08-02 | Holtz Naftali | Chief Financial Officer | BUY | 5,350 | $140.00 | $749,000 | 48,256 | No · +15.0% / +24.8% / +48.6% |
| 2024-07-30 | Fain Richard D | Director | SELL | 19,338 | $156.25 | $3.02M | 159,779 | No · +6.3% / +13.0% / +29.7% |
| 2024 Q2 — sales $23.2M · buys $0.00M · net −$23.2M | ||||||||
| 2024-06-13 | Fain Richard D | Director | SELL | 19,584 | $153.96 | $3.02M | 179,117 | No · +8.0% / −0.9% / +4.4% |
| 2024-06-03 | Lake Robert Alexander | SVP, CLO, Secretary & CCO | SELL | 7,750 | $148.78 | $1.15M | 19,647 | Yes · +2.9% / −8.0% / +5.7% |
| 2024-05-20 | Bayley Michael W | Pres & CEO, Royal Caribbean Intl | SELL | 49,155 | $147.67 | $7.26M | 49,695 | Yes · +1.7% / +13.9% / +9.3% |
| 2024-05-15 | Bayley Michael W | Pres & CEO, Royal Caribbean Intl | SELL | 24,201 | $140.21 | $3.39M | 98,850 | Yes · +5.6% / +19.3% / +9.9% |
| 2024-04-30 | Pujol Henry L | Chief Accounting Officer | SELL | 9,944 | $141.23 | $1.40M | 16,687 | No · +5.6% / +12.1% / +11.1% |
| 2024-04-26 | Liberty Jason T | President & CEO | SELL | 50,000 | $139.63 | $6.98M | 153,017 | No · +6.8% / +14.3% / +8.1% |
| 2024 Q1 — sales $2.4M · buys $0.00M · net −$2.4M | ||||||||
| 2024-02-27 | Fain Richard D | Director | SELL | 8,160 | $123.14 | $1.00M | 246,583 | No · +12.8% / +16.3% / +21.8% |
| 2024-02-13 | Bayley Michael W | Pres & CEO, Royal Caribbean Intl | SELL | 11,753 | $116.01 | $1.36M | 166,537 | No · +10.4% / +9.1% / +20.8% |
| 2023 Q4 — sales $124.3M · buys $0.00M · net −$124.3M | ||||||||
| 2023-12-14 | Wilhelmsen Arne Alexander | Director | SELL | 284,766 | $121.73 | $34.66M | 19,167,507 | No · +1.2% / −3.6% / +8.8% |
| 2023-12-13 | Wilhelmsen Arne Alexander | Director | SELL | 400,000 | $119.98 | $47.99M | 19,452,273 | No · +0.6% / −2.9% / +7.7% |
| 2023-12-12 | Wilhelmsen Arne Alexander | Director | SELL | 315,234 | $120.19 | $37.89M | 19,852,273 | No · +2.6% / −2.7% / +6.2% |
| 2023-11-29 | Kulovaara Harri U | EVP, Maritime | SELL | 24,707 | $106.90 | $2.64M | 33,650 | No · +22.3% / +20.3% / +16.4% |
| 2023-11-17 | Bayley Michael W | Pres & CEO, Royal Caribbean Intl | SELL | 7,800 | $105.00 | $819,000 | 94,391 | Yes · +14.7% / +16.4% / +11.6% |
| 2023-10-30 | Bethge Laura H | President, Celebrity Cruises | SELL | 3,502 | $86.00 | $301,172 | 22,226 | No · +23.4% / +50.8% / +48.4% |
| 2023 Q3 — sales $4.7M · buys $0.10M · net −$4.5M | ||||||||
| 2023-09-12 | Bayley Michael W | Pres & CEO, Royal Caribbean Intl | SELL | 10,000 | $100.02 | $1.00M | 102,191 | Yes · −10.2% / −1.2% / +21.6% |
| 2023-09-06 | Bayley Michael W | Pres & CEO, Royal Caribbean Intl | SELL | 10,000 | $97.43 | $974,300 | 112,191 | Yes · −8.1% / −8.5% / +15.6% |
| 2023-08-10 | Montiel Maritza Gomez | Director | BUY | 1,000 | $103.70 | $103,700 | 13,592 | No · −5.7% / −14.8% / −7.9% |
| 2023-08-01 | Pujol Henry L | Chief Accounting Officer | SELL | 18,908 | $106.74 | $2.02M | 23,521 | No · −7.9% / −14.7% / −20.1% |
| 2023-07-28 | Holtz Naftali | Chief Financial Officer | SELL | 5,949 | $110.62 | $658,119 | 30,967 | No · −9.4% / −16.7% / −23.7% |
| 2023 Q2 — sales $76.0M · buys $0.00M · net −$76.0M | ||||||||
| 2023-05-25 | Wilhelmsen Arne Alexander | Director | SELL | 318,325 | $77.97 | $24.82M | 20,167,507 | No · +24.8% / +32.1% / +31.5% |
| 2023-05-23 | Wilhelmsen Arne Alexander | Director | SELL | 203,800 | $80.15 | $16.33M | 20,485,832 | No · +23.5% / +30.5% / +25.9% |
| 2023-05-22 | Wilhelmsen Arne Alexander | Director | SELL | 375,000 | $80.74 | $30.28M | 20,689,632 | No · +21.2% / +27.4% / +23.6% |
| 2023-05-17 | Liberty Jason T | President & CEO | SELL | 36,536 | $80.00 | $2.92M | 147,078 | Yes · +19.7% / +24.1% / +30.1% |
| 2023-05-17 | Bayley Michael W | Pres & CEO, Royal Caribbean Intl | SELL | 20,624 | $80.00 | $1.65M | 122,191 | Yes · +19.7% / +24.1% / +30.1% |
| 2023 Q1 — sales $0.4M · buys $0.00M · net −$0.4M | ||||||||
| 2023-03-06 | Sorensen Vagn O | Director | SELL | 6,000 | $74.36 | $446,149 | 29,265 | No · −16.4% / +2.0% / +18.1% |
| 2022 Q4 — sales $85.9M · buys $0.00M · net −$85.9M | ||||||||
| 2022-12-13 | Wilhelmsen Arne Alexander | Director | SELL | 13,600 | $58.19 | $791,421 | 21,064,632 | No · +12.0% / +32.7% / +15.2% |
| 2022-12-12 | Wilhelmsen Arne Alexander | Director | SELL | 78,927 | $57.00 | $4.50M | 21,078,232 | No · +3.9% / +25.7% / +12.6% |
| 2022-12-08 | Wilhelmsen Arne Alexander | Director | SELL | 9,762 | $58.00 | $566,196 | 21,157,159 | No · +0.4% / +21.0% / +26.5% |
| 2022-12-05 | Wilhelmsen Arne Alexander | Director | SELL | 396,990 | $60.24 | $23.91M | 21,166,921 | No · −11.4% / +15.2% / +24.8% |
| 2022-12-02 | Wilhelmsen Arne Alexander | Director | SELL | 398,698 | $60.49 | $24.12M | 21,563,911 | No · −19.5% / +7.3% / +18.9% |
| 2022-12-01 | Wilhelmsen Arne Alexander | Director | SELL | 522,289 | $61.23 | $31.98M | 21,962,609 | No · −20.0% / +3.4% / +17.4% |
| 2022 Q2 — sales $0.0M · buys $0.15M · net +$0.1M | ||||||||
| 2022-06-09 | Sorensen Vagn O | Director | BUY | 2,785 | $53.73 | $149,638 | 32,583 | No · −34.0% / −18.5% / −11.3% |
| 2022 Q1 — sales $3.2M · buys $0.00M · net −$3.2M | ||||||||
| 2022-03-29 | Bayley Michael W | Pres & CEO, Royal Caribbean Intl | SELL | 3,637 | $80.00 | $290,960 | 116,951 | Yes · −0.3% / −28.3% / −50.2% |
| 2022-03-25 | Bayley Michael W | Pres & CEO, Royal Caribbean Intl | SELL | 3,859 | $77.02 | $297,222 | 120,588 | Yes · +7.1% / −35.4% / −53.1% |
| 2022-02-15 | Bayley Michael W | Pres & CEO, Royal Caribbean Intl | SELL | 2,529 | $85.92 | $217,286 | 133,724 | No · −13.1% / −5.7% / −28.8% |
| 2022-02-10 | Lutoff-Perlo Lisa | Pres & CEO, Celebrity Cruises | SELL | 10,435 | $87.93 | $917,565 | 75,318 | No · −22.4% / −10.3% / −31.8% |
| 2022-02-10 | Bayley Michael W | Pres & CEO, Royal Caribbean Intl | SELL | 16,904 | $88.11 | $1.49M | 136,253 | No · −22.4% / −10.3% / −31.8% |
| 2021 Q4 — sales $0.2M · buys $0.00M · net −$0.2M | ||||||||
| 2021-10-11 | Lutoff-Perlo Lisa | Pres & CEO, Celebrity Cruises | SELL | 2,591 | $87.45 | $226,584 | 64,039 | Yes · +0.1% / −14.9% / −9.9% |
Insider Buying vs. Selling Analysis
| Transaction Type (EDGAR, 5 Years) | Lines | Shares | Value |
|---|---|---|---|
| S — open-market sale | 229 | 6,996,226 | $1,267.0M |
| P — open-market purchase | 3 | 9,135 | $1.0M |
| F — tax withholding | 164 | 718,661 | $156.5M |
| A — grant / award | 142 | 1,822,005 | $0 |
| G — gift | 8 | 364,115 | $0 |
10b5-1 share: only $22.1 million of $1,267 million (1.7%) was sold under plans — 10.9% excluding Wilhelmsen. Most RCL insider selling is discretionary, which makes it more informative than typical plan-driven selling.
Quarterly trend: 22-Q4 −$86M · 23-Q2 −$76M · 23-Q4 −$124M · 24-Q4 −$253M · 25-Q1 −$41M · 26-Q1 −$627M (a record) · 26-Q2 $0 · 26-Q3 −$4M. Selling comes in waves tied to February vesting windows and Wilhelmsen block programs. There has been no selling (and no buying) since the July 29 Bayley sale.
| Insider | Buys | Sales (# / Shares / $) | % 10b5-1 | Shares Granted |
|---|---|---|---|---|
| A.A. Wilhelmsen (Director) | $0 | 123 / 6,063,988 / $1,064.9M | 0% | 9,011 |
| Michael Bayley (CEO, RCI) | $0 | 29 / 302,407 / $61.8M | 25% | 431,072 |
| Jason Liberty (Chairman & CEO) | $0 | 18 / 235,446 / $54.8M | 5% | 612,509 |
| Richard Fain (Director) | $0 | 12 / 146,082 / $31.1M | 0% | 210,158 (+338,876 gifted) |
| Naftali Holtz (CFO) | $0.75M | 16 / 74,080 / $21.9M | 0% | 123,458 |
| Henry Pujol (CAO) | $0 | 7 / 45,224 / $8.0M | 0% | 30,240 |
| Harri Kulovaara (EVP Maritime) | $0 | 4 / 47,348 / $7.5M | 0% | 107,632 |
| Laura Hodges Bethge (President, Celebrity) | $0 | 8 / 29,421 / $7.3M | 7% | 63,522 |
| Vagn Sorensen (Director) | $0.15M | 3 / 22,100 / $4.8M | 0% | 9,011 |
| Robert Lake (CLO) | $0 | 3 / 13,119 / $2.7M | 100% | 58,855 |
| Maritza Montiel (Director) | $0.10M | 3 / 3,985 / $1.1M | 0% | 9,011 |
Insider Ownership Roster
From the 2026 proxy (April 9, 2026), valued at $282.26.
| Insider | Shares | Value | % Outstanding | Trend |
|---|---|---|---|---|
| A.A. Wilhelmsen (AWILHELMSEN AS) | 16,443,779 | $4.64B | 6.13% | ↓ from 21.96M (−25%) |
| Richard Fain | 271,162 | $76.5M | 0.10% | ↓ (includes 68,176 in the Fain Family Foundation) |
| Jason Liberty (Chairman & CEO) | 169,595 (Form 4: 218,822) | $47.9M ($61.8M) | 0.06% | → grants offset sales |
| Harri Kulovaara | 57,740 | $16.3M | 0.02% | → |
| Michael Bayley | 52,232 (Form 4: 45,297) | $14.7M | 0.02% | ↓ |
| Eyal Ofer (Director) | 42,925 | $12.1M | 0.02% | → |
| Donald Thompson (Director) | 39,561 | $11.2M | 0.01% | → |
| Amy McPherson, Ann Moore, John Brock, Stephen Howe, M. Montiel, V. Sorensen, M. Leavitt, R. Yeung | 4.8K – 29K each | $1.4M – $8.2M each | <0.01% each | → |
| Laura Hodges Bethge | 23,751 (Form 4: 32,519) | $6.7M | 0.01% | → |
| Naftali Holtz (CFO) | 15,493 (Form 4: 28,116) | $4.4M | 0.01% | ↓ — low for a CFO |
| C. Wiernicki (Director, joined 2026) | 444 | $0.1M | ~0% | New |
| All 19 directors & officers | 17,270,660 | $4.87B | 6.4% | Excluding Wilhelmsen: 826,881 shares ≈ $233M (0.3%) |
There are no pledged shares; pledging and hedging are prohibited. The only insider above 1% is the founding family. Executive “skin in the game” is modest relative to pay: Liberty’s 2025 “compensation actually paid” was $49 million, roughly his entire holding.
Insider Timing Analysis
| Group | 30d Mean / % Negative | 60d Mean / % Negative | 90d Mean / % Negative |
|---|---|---|---|
| All sales (n=79) | −0.9% / 48% | +1.2% / 51% | +4.1% / 41% |
| Discretionary (non-plan) sales (n=65) | −2.5% / 54% | +0.6% / 52% | +3.4% / 45% |
| 10b5-1 plan sales (n=14) | +6.6% / 21% | +3.6% / 43% | +7.2% / 21% |
| Wilhelmsen (n=27) | −3.6% / 56% | +2.1% / 52% | +4.3% / 37% |
| Fain (n=8) | +8.2% / 12% | +8.2% / 25% | +15.1% / 25% |
| Buys (n=3) | −8.2% | −2.9% | +9.8% |
| All trading days (baseline) | +2.8% / 43% | +6.4% / 39% | +10.1% / 34% |
Sale clusters (2 or more insiders within 14 days, or more than $10 million):
| Window | Insiders | $ Sold | 30d | 60d | 90d |
|---|---|---|---|---|---|
| Feb 13–27, 2026 | 7 (Bayley, Bethge, Holtz, Liberty, Montiel, Pujol, Wilhelmsen) | $626.7M | −12.1% ✔ | −11.9% ✔ | −17.0% ✔ |
| Jul 30 – Aug 6, 2025 | 2 (Fain, Pujol) | $6.7M | +9.7% | −1.3% | −11.5% ✔ |
| May 12–19, 2025 | 2 (Fain, Montiel) | $5.3M | +10.6% | +39.8% | +25.1% |
| Feb 13–18, 2025 | 5 (Bayley, Bethge, Fain, Holtz, Liberty) | $41.5M | −15.6% ✔ | −26.2% ✔ | −3.4% |
| Nov 15–21, 2024 | 2 (Kulovaara, Wilhelmsen) | $238.2M | +5.0% | −0.8% | +12.4% |
| Oct 30 – Nov 5, 2024 | 3 (Fain, Kulovaara, Pujol) | $14.6M | +17.1% | +11.7% | +27.3% |
| Dec 12–14, 2023 | 1 (Wilhelmsen) | $120.5M | +2.6% | −2.7% | +6.2% |
| May 17–25, 2023 | 3 (Bayley, Liberty, Wilhelmsen) | $76.0M | +19.7% | +24.1% | +30.1% |
| Dec 1–13, 2022 | 1 (Wilhelmsen) | $85.9M | −20.0% | +3.4% | +17.4% |
Assessment: RCL insiders’ sales have been followed by below-baseline returns (−0.9% vs. +2.8% at 30 days; +4.1% vs. +10.1% at 90 days), and discretionary sales more so than plan sales. The two largest executive clusters — February 2025 and February 2026 — both preceded double-digit declines. This is a mildly informative selling signal, not noise. Fain’s sales, by contrast, were badly timed. Three buys are too few to judge, but the one meaningful executive buy (Holtz at $140) was excellent.
Top Institutional Holders
From 13F filings for the period ending June 30, 2026.
| Manager | Shares | % of RCL | Q/Q Change | Avg. Cost | First Owned |
|---|---|---|---|---|---|
| Capital Research Global Investors | 34,256,274 | 12.77% | +6.00M (+21.2%) … then cut to 6.4% by 9/30 (13G/A) | $93.82 | Q1’20 |
| Capital International Investors | 24,493,815 | 9.13% | −557.6K (−2.2%) | $112.23 | Q2’19 |
| BlackRock | 20,626,151 | 7.69% | −1.43M (−6.5%) | $226.46 | Q3’24* |
| Capital World Investors | 18,670,920 | 6.96% | −1.39M (−6.9%) | $139.33 | Q2’23 |
| Vanguard Capital Management | 16,027,157 | 5.98% | −55.7K (−0.3%) | $297.01 | Q1’26* |
| Vanguard Portfolio Management | 12,248,670 | 4.57% | −32.7K (−0.3%) | $297.01 | Q1’26* |
| Osiris Holdings Inc. | 11,708,700 | 4.37% | NEW (100% of its 13F book) | $279.56 | Q2’26 |
| State Street | 10,689,134 | 3.99% | +270.9K (+2.6%) | $92.71 | Q2’13 |
| Geode Capital | 6,945,690 | 2.59% | −102.8K (−1.5%) | $123.37 | Q2’13 |
| JPMorgan Chase | 3,770,769 | 1.41% | +337.2K (+9.8%) | $124.13 | Q2’13 |
*“First owned” counts from when the filing entity began reporting (entity restructurings at BlackRock and Vanguard). Osiris Holdings holds RCL as 100% of its reported portfolio — possibly a family or holding vehicle; unverified.
Top funds: Growth Fund of America 6.11%, Investment Co. of America 4.77%, Bond Fund of America 4.58%, Washington Mutual 3.14%, Strategic Income Opportunities 2.82%, New Perspective 2.53% — overwhelmingly Capital Group (American Funds) products.
Institutional Ownership Trends
| Signal | Detail | Read |
|---|---|---|
| Capital Research Global halved its stake | 34.26M shares (12.8%) on 6/30/26 → 17.15M (6.4%) on 9/30/26 per a 13G/A filed October 6. About 17.1M shares (≈$4.5B at Q3 prices) sold in one quarter — about 7 full days of RCL’s average volume, or ~11% of everything that traded in Q3. | Bearish — the largest holder distributing; likely a big part of the August–September supply |
| Capital International trimmed | 37.1M (13G as of 3/31/26) → 24.5M (6/30 13F) → 25.76M (9.5%) in the latest 13G/A | Mildly bearish |
| Passive holders steady | Vanguard ~10.6% combined, BlackRock 7.5–7.7%, State Street ~4% | Neutral |
| New concentrated holder | Osiris Holdings: 11.7M shares (4.37%) at a ~$280 average | Mildly bullish (a conviction buyer at today’s price) |
| Smaller adds | JPMorgan +9.8%, State Street +2.6%; Bank of America bought 1.01M shares (Sep 17 13F) | Mildly bullish |
| Concentration | Capital Group’s three entities held ~29% of RCL at mid-year; the top 3 holders own ~30% of the float | Crowded-holder risk; further Capital Group selling would be a persistent overhang |
Total institutional ownership is 80.5%, with recent institutional transactions of +0.23%. The aggregate is roughly flat, but the composition is shifting from a concentrated active holder (Capital Research) toward passive and new holders.
Smart Money Signals
- No famous stock-pickers (Berkshire, Icahn, Ackman, Druckenmiller) and no 13D/activist filers in RCL. The activist in the sector is Elliott at Norwegian (NCLH), disclosed October 7.
- The “smartest” money in this name is Capital Group. It built a ~29% position at $93–139 average cost through COVID and is now taking profits. Its flagship growth unit halving its stake in Q3 is the most important institutional data point.
- Options flow: heavy put buying into earnings ($250 puts, December 270/250 put spreads, June 2027 $130 tail puts) alongside a $600K March 2027 $300-call buy on September 22 and a put whale closing $220/$250 puts for profit at the lows.
- No insider buying cluster has coincided with institutional accumulation at any point in the last two years.
Lockup and Compensation Context
No lockups — RCL has been public since 1993. Vesting drives the calendar. Performance shares vest each February after results; in February 2026 the 2023–25 PSUs paid 298% of target (Liberty 275,686 shares, Bayley 167,810, Holtz 60,411), and executives sold within days, outside 10b5-1 plans. That makes February sales partly mechanical (diversifying outsized grants), but they are still discretionary in timing and size.
10b5-1 plans: adoption dates were found for Bayley (February 11, 2022; February 24, 2023; June 7, 2023) and Liberty (February 24, 2023). Only ~11% of non-Wilhelmsen sale dollars ran through plans. Wilhelmsen: five block programs since December 2022, each a few weeks long — consistent with a deliberate multi-year diversification of a $4.6 billion family holding rather than a reaction to company news.
Insider and Institutional Bottom Line
The insider signal is neutral-to-bearish. The people who know RCL best have been sellers, not buyers, for five years: $1.27 billion out versus $1.0 million in, and not a single purchase in 26 months — not even at $222 last month. Most of the dollars are the founding family diversifying and executives monetizing outsized performance grants, so this is not the panic-selling pattern that precedes collapses. But it is discretionary, it has been well timed (the last two February clusters preceded 17–28% declines), and the absence of any dip-buying is telling.
The institutional signal is mildly bearish. Capital Research Global Investors — the holder that rode RCL from the COVID lows at a ~$94 average — sold about half its position in Q3, roughly $4.5 billion of stock. That goes a long way to explaining the August–September slide independent of fuel or Sandals. Passive holders are steady, and a new concentrated holder (Osiris) bought in near today’s price.
Risk Factors
| Risk | Probability | Impact | Detail |
|---|---|---|---|
| 1. Yield stall becomes a decline (the biggest risk) | MEDIUM (30%) | HIGH | A consumer slowdown turns ~2% yields negative; every 1% of yield ≈ $155M of revenue or ~$0.58/share of EPS. Stock → $205–230. |
| 2. Fuel / geopolitics | MEDIUM | MEDIUM | Brent stays above $100; a repeat of April’s $0.62/share guide cut; TUI’s Middle East exposure. Only 58% of 2026 and 53% of 2027 fuel is hedged. |
| 3. Leverage / credit rating | LOW-MEDIUM | HIGH | Sandals plus the 2028 capex hump push leverage toward 3.9× in the bear case; a downgrade below BBB−/Baa3 triggers swap collateral and lifts funding costs. |
| 4. Holder overhang | MEDIUM | MEDIUM | Capital Group’s remaining ~22% keeps distributing, with no insider buying to absorb it. |
| 5. Unreserved legal / destination hits | LOW | LOW-MEDIUM | Havana Docks remand (treble damages possible; the $124M reserve was already released); a possible Perfect Day Mexico impairment (~$294M); Labadee closed through mid-2027. |
| 6. Back-end-loaded 2026 guidance | LOW-MEDIUM | MEDIUM | The full-year guide implies Q4 EPS of $3.56–3.80 vs. $2.80 a year ago (+27–36%) on flat Q3 yields. A 16-for-16 beat record lowers the odds of a miss, but this is where guidance risk lives. |
| 7. Sandals returns below RCL’s ROIC | MEDIUM | MEDIUM | An estimated ~10% pre-depreciation return vs. 18% ROIC and ~$160M a year of new interest; equity-method accounting means near-term accretion is likely close to zero. |
| 8. 2028 refinancing hump | LOW-MEDIUM | MEDIUM | $8.04B of 2028 debt maturities and ship payments exceeds ~$6.5–7B of annual operating cash flow; refinancing-dependent if credit markets tighten. |
| 9. Promotional creep / brand erosion | MEDIUM | MEDIUM | 2×-points offers, casino-mailer blitzes, repricing threads and food-budget complaints from loyal guests. Early, but consistent with a softer pricing year. |
| 10. Shareholder returns cut | LOW-MEDIUM | MEDIUM | The FY2025 10-K added “no assurance of dividends or buybacks at historical levels.” Buybacks would likely pause first to defend the rating in a downturn. |
| 11. Euro-denominated order book | LOW-MEDIUM | LOW-MEDIUM | 52.6% of the $16.5B order book is in euros; a 10% stronger euro adds ~$727M of cost. |
| 12. Uninsured disruption | LOW | HIGH | No business-interruption insurance on ships; war-risk cover is cancellable on 7 days’ notice. |
| 13. Volatility and beta | HIGH | MEDIUM | Beta 1.6–1.9, 48% realized volatility, a ~7% average earnings-day move and two 35–40% drawdowns in 20 months. Position size, not the thesis, is the main defense. |
| 14. Key-person succession | LOW | LOW-MEDIUM | Michael Bayley (67) and Harri Kulovaara (73) are two key operators near retirement. |
What would change my call. I would upgrade to BUY on (a) a pullback to $250–265 with the thesis intact, or (b) a Q3 print delivering Q4 yields of at least 4% and a 2027 yield outlook of at least +3%, with a daily close above $289.30 on volume. I would downgrade to SELL if 2027 commentary implies EPS below ~$19, if yields turn negative, or if ratings go on negative watch. The thesis is broken on a daily close below $222 (the September capitulation low).
Conclusion: RCL Stock Forecast and Price Targets
RCL Earnings Model: Three Scenarios
Shared inputs: capacity +6.6% (2026), +4% (2027) and +6% (2028) per the company; fuel 58% hedged for 2026 at $474/mt and 53% for 2027 at $405/mt; a ~2% tax rate; 268 million diluted shares today. Capex: FY26 ~$4.7 billion (guide); FY27 ≈ $2.46 billion of ship payments + ~$1.7 billion non-ship ≈ $4.2 billion; FY28 ≈ $4.59 billion + ~$1.8 billion ≈ $6.4 billion.
Free cash flow = operating cash flow − capex, excluding the ~$3 billion Sandals outflow (debt-funded, early 2027). Sandals is accounted for under the equity method, so it shows up in net income, not EBITDA.
| Line | FY2025A | FY2026E | FY2027E | FY2028E | Driving Assumption |
|---|---|---|---|---|---|
| BEAR CASE (25% probability) | |||||
| Revenue | $17.94B | $19.40B | $20.10B (+3.5%) | $21.30B (+6%) | Yields −1% in 2027, flat in 2028 (consumer slowdown; promotions widen) |
| Adj. EPS | $15.64 | $17.60 | $17.25 | $18.00 | Brent above $100; unit costs +2%; Sandals slightly dilutive; buybacks paused to defend the rating |
| Free cash flow | $1.24B | $1.7B | $2.1B | ~$0.2B | The 2028 capex hump absorbs nearly all operating cash flow |
| Net debt / EBITDA | 3.0× | ~3.1× | ~3.9× | ~3.8× | Downgrade risk → swap-collateral trigger |
| BASE CASE (50% probability) | |||||
| Revenue | $17.94B | $19.55B (+9.0%) | $20.95B (+7%) | $22.75B (+8.7%) | Yields +2% (2026), +3% (2027), +2.5% (2028) on company capacity |
| Adj. EPS | $15.64 | $17.85 | $19.90 | $22.30 | The low-end guidance beat continues; unit costs ex-fuel +1–2%; Sandals EPS-neutral; ~$1.0–1.2B a year of buybacks; ~2% below FY27 consensus ($20.31) |
| Free cash flow | $1.24B | $2.2B | $3.1B | $1.6B | FY28 free cash flow ≈ dividends (~$1.6B) → buybacks are debt-funded that year |
| Net debt / EBITDA | 3.0× | ~3.0× | ~3.4× | ~3.3× | Holds investment grade |
| BULL CASE (25% probability) | |||||
| Revenue | $17.94B | $19.70B | $21.25B (+8.7%) | $23.40B (+10%) | Yields +4.5% (2027), +4% (2028); Q4 2026 ≥ +4% confirmed |
| Adj. EPS | $15.64 | $18.05 | $21.00 | $24.15 | Brent ~$75 (Iran resolution); flat unit costs; Sandals +$0.30; Perfecta beaten |
| Free cash flow | $1.24B | $2.5B | $3.5B | $2.2B | Margin expansion funds both ships and returns |
| Net debt / EBITDA | 3.0× | ~2.9× | ~3.1× | ~2.9× | Upgrade to BBB (the S&P outlook is already positive) |
How I Get to a $315 Price Target
| Method | Math | Value / Share |
|---|---|---|
| P/E on FY27 (base) | $19.90 × 16× (RCL’s 2024–26 average forward multiple) | $318 |
| P/E on FY28 (base), 12 months out | $22.30 × 14× (the forward multiple one year further out) | $312 |
| EV / EBITDA (FY27) | ~$8.0B adj. EBITDA × 13× = $104B − ~$25.5B net debt (post-Sandals) + ~$3B Sandals stake = $81.5B ÷ 264M shares | $309 |
| Probability-weighted scenarios | 25% × $205 + 50% × $315 + 25% × $380 | $304 |
| Street | Finviz mean $354.69; FactSet ~$351; range $298 (Truist) – $425 (Tigress) | $351–355 |
| My target | A blend of the above, rounded up modestly for the guidance-beat record | $315 |
RCL’s ~75% EV/EBITDA premium to CCL and NCLH is justified by margins 11 points higher and an investment-grade balance sheet. Re-rating toward Viking (20×) requires Viking-like growth, which ~2% yields don’t provide.
Bull vs. Bear Price Targets
Bull Case ($380, +35%)
- Q4 2026 net yields of at least 4% confirm the Q3 trough was itinerary-driven
- 2027 yields +4.5% and 2028 +4%; EPS of $21.00 (2027) and $24.15 (2028)
- Brent falls to ~$75 on an Iran resolution; flat unit costs
- Sandals adds ~$0.30 of EPS; Perfecta is beaten
- Leverage falls to ~2.9×; upgrade to BBB
- (The fundamentals-only math — $20.50 × 17× — lands at ~$350)
Bear Case ($205, −27%)
- A U.S. consumer slowdown turns yields negative (−1% in 2027)
- Brent stays above $100; unit costs +2%
- Sandals is slightly dilutive; ~$160M a year of new interest
- Buybacks pause to defend the rating; leverage drifts to ~3.9×
- 2027 EPS of ~$17.00–17.25 × a 12× trough multiple
Base case ($315, +11.6%): yields of +3% in 2027, the beat record continues at the low end, Sandals is EPS-neutral, and 2027 EPS lands at $19.90 — about 2% below consensus. At 16× that is a market-like return for a stock with nearly twice the market’s volatility.
What Has to Go Right
| # | Condition | How I’ll Know |
|---|---|---|
| 1 | Q4 2026 net yields grow ≥4% (constant currency), confirming the Q3 trough was itinerary-driven | October 27 guide |
| 2 | A 2027 net-yield outlook of ≥+3% with unit costs ex-fuel ≤+1%, keeping FY27 EPS ≥$20.30 (the Perfecta path) | October 27 commentary; January 2027 guide |
| 3 | Brent back below ~$85 (Iran/Hormuz de-escalation) — every $10/bbl move is worth roughly $0.25–0.35 per share a year on the ~45% of fuel that is unhedged | The oil tape |
| 4 | The Sandals bridge termed out in investment-grade bonds at <5.5%, with ratings affirmed and net leverage guided back to ≤3.0× by year-end 2027 | Bond deal; S&P and Moody’s actions |
| 5 | Promotional activity normalizes — no further 2×-points or casino-mailer blitzes into Wave season | Consumer forums; January–March 2027 Wave season pricing |
Catalyst Timeline
| Date | Event | Bull Outcome | Bear Outcome |
|---|---|---|---|
| Oct 27, 2026 | Q3 2026 earnings (before the open, 10 a.m. call) — guide $6.26–6.36, consensus $6.36 | Beat + Q4 yields ≥4% + 2027 ≥+3% → breakout above $289 toward $305–320 | Q4 yields below 3% or soft 2027 color → back to $250–265 (gap fill) |
| Nov 2026 | Analyst / investor day (cited by Citi) | A credible Perfecta successor; leverage target ≤3× | Big new land/river spending ambitions |
| Q4 2026 – Q1 2027 | Sandals bond refinancing; deal close | Tight investment-grade pricing, ratings affirmed | Wide pricing / negative outlook |
| Late Jan 2027 | Q4 results + full-year 2027 guide | EPS guide ≥$20.30 (a “$20 handle”) | Guide below $19.50 |
| Jan – Mar 2027 | Wave season (peak booking period) | Record volumes at higher prices | Heavier promotions |
| Feb 2027 | PSU vesting → the typical insider sale window | Light selling / any buying | Another large cluster |
| Ongoing | Brent / Iran / Hormuz; the Fed path | Oil below $85, rate cuts | Oil above $100, hikes |
| Aug 1, 2027 | Hero of the Seas (4th Icon-class ship) debut | New-ship yield premium | — |
Cross-Report Evidence
| Research Strand | Signal | Key Finding |
|---|---|---|
| Sentiment | Mixed (lean bullish) | ~58/42 bullish; the sell side and media cheer the dip, but fresh options flow is protective puts and consumer forums show discounting tells. |
| Fundamental | Mixed | Best-in-class margins and ROIC at 13.9× FY27, but yields ~2%, Q2 EPS down year over year, trailing free cash flow negative, and debt back to $23.4B. |
| Technical | Mixed | A textbook selling climax and V-bottom, now stalled at the $285.6–289.3 confluence on fading volume; the 14-month lower-high structure is intact. |
| News | Bullish | 47/37/16 bullish/neutral/bearish; the Sandals narrative flipped from alarm to endorsement in 10 days on three upgrades and Carnival’s record Q3. |
| SEC Filings | Mixed | Credibility HIGH (8/10, 16/16 beats), but capital allocation has flipped to re-levering; unreserved Havana Docks and Mexico permit risk; a 298% PSU payout on soft targets. |
| Insider / Institutional | Bearish-leaning | $1.27B sold vs. $1.0M bought in 5 years, no buy in 26 months; Capital Research halved its 12.8% stake in Q3. |
Alignment: divergent. The opinion-driven signals (news, sell side) are bullish. The real-money and legally mandated signals (insiders, Capital Group’s 13G, options hedging, the SEC-disclosed capital-allocation shift) are cautious-to-bearish. Fundamentals and technicals both say “fairly valued near $280–290.” Because I give the SEC and insider evidence extra weight, this divergence caps conviction at MEDIUM and argues against initiating here.
Action Plan and Position Sizing
| Situation | Action |
|---|---|
| If you own it | Hold. Consider trimming above $305–320 if Q3 does not deliver the bull conditions. |
| New money — size | Max 1–2% of a portfolio (beta 1.6–1.9, 48% realized volatility, a $12 ATR, a ~7% average earnings-day move, two 35–40% drawdowns in 20 months). |
| New money — entry | Do not chase into earnings at $282. Scale in thirds at $265 / $252 (gap fill) / $242 (61.8% Fibonacci); or buy a confirmed close above $289.30 on more than 3.5M shares after a strong Q3. |
| Options approach | With implied volatility elevated into October 27, income-oriented investors can get paid to wait: a cash-secured put at the $250 strike (a level I’d be happy owning) after the print expresses the “buy the pullback” view with a defined entry. |
| Exit | Target $315, with a trailing review at $334 (the prior lower high). Stop / thesis break on a daily close below $222. |
Bottom Line
Royal Caribbean is the best ship in the fleet, sailing into choppier water with a heavier load. The business is excellent, and the stock is reasonably priced at ~14× 2027 earnings.
But pricing growth has faded to ~2%. Management just borrowed $3 billion to buy half a hotel company while spending more than it earns in free cash. And nobody who runs or founded the company has bought a share in over two years.
At $282 you are paid about a market return for a stock with nearly twice the market’s volatility. HOLD with a $315 target: keep what you own, let the October 27 print prove 2027, and be a buyer at $250–265 — not at the 200-day wall.
Frequently Asked Questions
Is RCL a good stock to buy right now?
Based on this RCL stock analysis, Royal Caribbean is a HOLD at $282.26, not a fresh buy. The business is the best operator in cruising, with a 39.2% adjusted EBITDA margin, an 18% return on invested capital and 16 straight quarters above the top of its own guidance. But net yield growth has slowed to about 2%, free cash flow is negative on a trailing basis, and the stock sits right under its $286 to $289 resistance wall. My base case is $315 in 12 months, about 11.6% upside, against a bear case of $205. I would be a buyer at $250 to $265, or after a strong October 27 earnings report.
What is the RCL stock price target?
My 12-month price target for RCL is $315, about 11.6% above the $282.26 close on October 9, 2026, or 13.7% including the $6.00 annual dividend. It blends 16 times my $19.90 base-case 2027 EPS ($318), 14 times 2028 EPS ($312), an EV/EBITDA cross-check ($309) and a probability-weighted scenario value ($304). The Wall Street consensus is higher at about $351 to $355, with a range of $298 (Truist) to $425 (Tigress Financial). My bull case is $380 and my bear case is $205.
Should I buy or sell Royal Caribbean stock?
Neither, at today's price. If you own RCL, hold it and let the October 27 Q3 report prove the 2027 outlook, and consider trimming above $305 to $320 if it does not. If you do not own it, do not chase it into earnings at $282. Scale in at $265, $252 and $242, or buy a confirmed daily close above $289.30 on more than 3.5 million shares after a strong print. A daily close below $222 breaks the thesis.
What is the RCL stock forecast for 2027?
My base case has Royal Caribbean earning $19.90 of adjusted EPS in 2027, about 2% below the $20.31 consensus, on revenue of $20.95 billion and net yield growth of about 3%. At 16 times earnings that supports roughly $315. The bull case of $21.00 EPS and a $380 stock needs Q4 2026 yields of at least 4% and a 2027 yield outlook of at least 3%. The bear case of $17.25 EPS and a $205 stock comes from a consumer slowdown that turns yields negative.
Does Royal Caribbean stock pay a dividend?
Yes. Royal Caribbean pays $1.50 per share each quarter, or $6.00 a year, which is about a 2.1% yield at $282.26. The dividend was reinstated in July 2024 at $0.40 a quarter after the COVID suspension and has been raised four times since, including a 50% increase announced with fourth-quarter results in January 2026. The payout is only about 34% of 2026 earnings, so profits cover it easily. The catch is cash: trailing free cash flow is negative, and the FY2025 10-K added a warning that dividends and buybacks may not continue at historical levels. I would not own RCL for the yield alone.
Is Royal Caribbean a better stock than Carnival?
Royal Caribbean is the better business, and Carnival is the cheaper stock. RCL earns a 27.1% operating margin against 16.0% for Carnival (CCL), an 11-point gap. Investors already pay for that: RCL trades at 13.9 times forward earnings and 14.3 times EV/EBITDA, versus 10.3 and 8.1 for Carnival, while both are expected to grow EPS about 14% next year. The quality premium is already in the price, which is a big part of why I rate RCL a HOLD at $282.26 rather than a buy.
What does the Sandals deal mean for RCL stock?
Royal Caribbean agreed to buy 50% of Sandals and Beaches Resorts for about $3 billion, roughly 10 times forward EBITDA, funded entirely with a 364-day Morgan Stanley bridge loan. It closes in early 2027. Bulls see a cheap way to capture more of the vacation wallet. My concern is the math: RCL books its share of Sandals net income rather than EBITDA, the stake earns an estimated 10% pre-depreciation return against RCL's 18% ROIC, and it adds about $160 million a year of interest. It also pushes pro-forma leverage to about 3.5 times while RCL's credit ratings sit one notch above the level where swap counterparties can demand collateral.
If you are looking at RCL for an options income strategy, the high implied volatility around earnings works in your favor, as long as you plan for the IV crush that follows the October 27 report. The share price matters too: one contract at the $250 strike ties up $25,000 of cash. I walk through the mechanics in selling cash secured puts and in my guide to the options wheel strategy. A 1.6–1.9 beta also makes RCL a more aggressive wheel candidate than the names in the best stocks for the wheel strategy. And if you already own RCL above today’s price, lowering your stock basis using options is one way to work the position while you wait for the 2027 story to play out. If you plan to trim at $305 to $320 anyway, selling covered calls at those strikes gets you paid to wait.
Sources: SEC Filings (CIK 0000884887), Finviz Elite, OpenInsider, Google News, Reuters, Bloomberg, CNBC, Barron’s, Reddit, Twitter/X. Report compiled October 10, 2026, with prices as of the October 9, 2026 close.