SNDK (Sandisk) Analysis: Hold at $662 | $550 Target
Table of Contents
Executive Summary
This SNDK stock analysis — a comprehensive Sandisk stock analysis — covers the company’s fundamentals, technicals, SEC filings, market sentiment, and insider activity as of March 2026. Here is the bottom line:
- HOLD — do NOT initiate a new position. Sandisk is a genuinely great business riding a once-in-a-decade NAND flash supercycle, but the stock price at $661.62 has already discounted the best-case scenario. At 10.86x EV/Sales versus 2–3x for peers, the risk/reward is asymmetric to the downside.
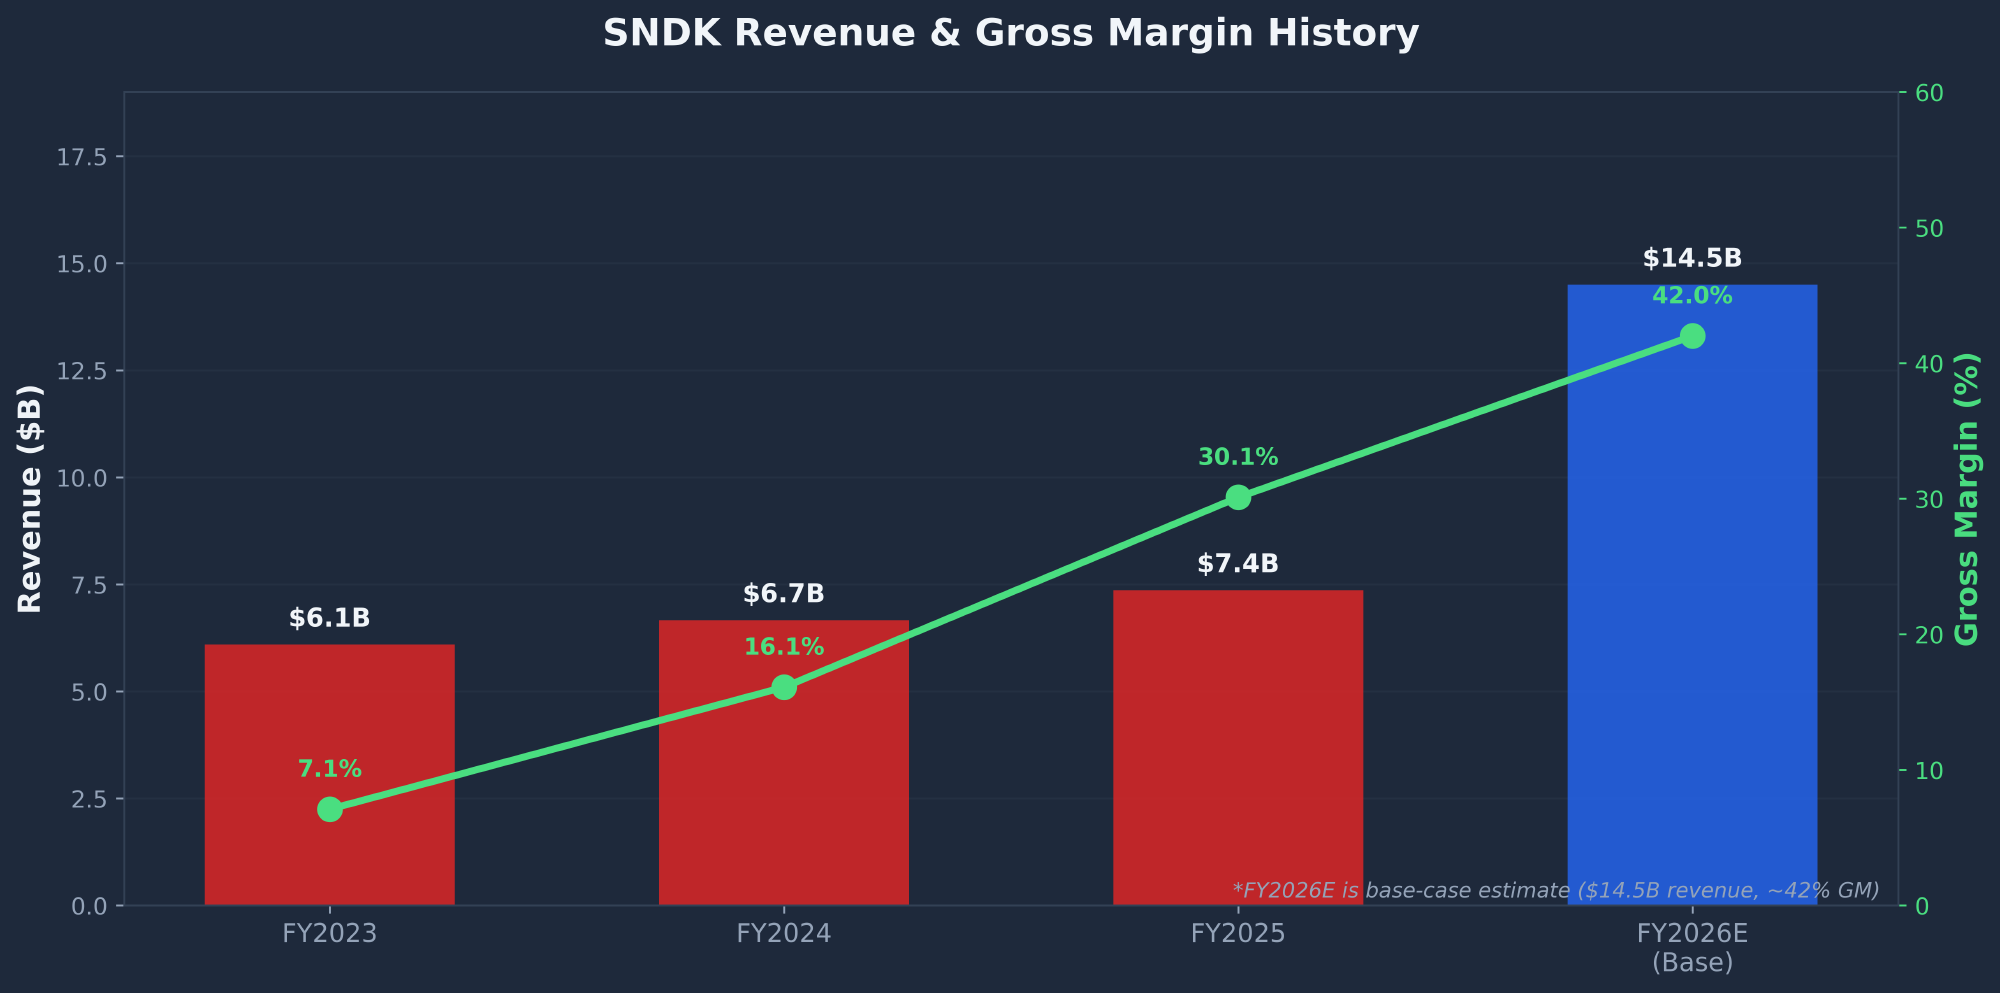
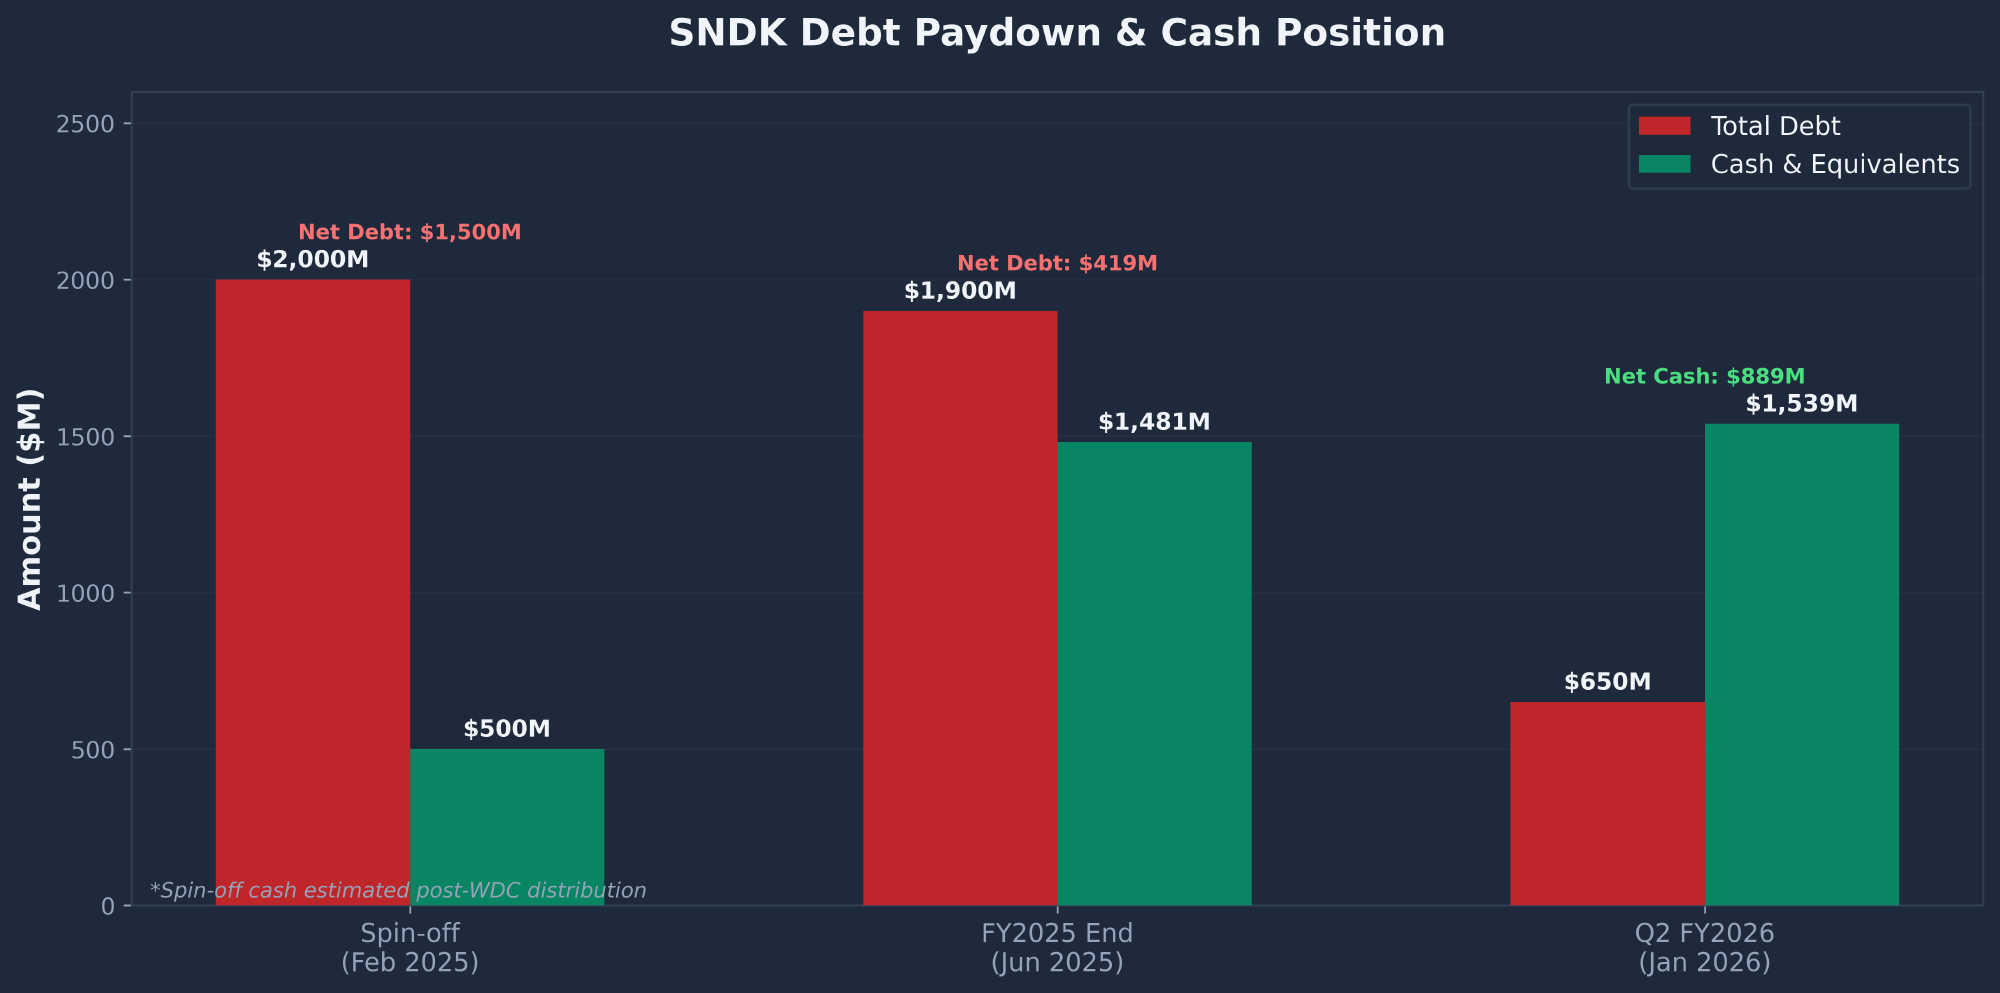
- The business transformation is real and extraordinary. Gross margins swung from 7.1% (FY2023 trough) to a record 50.9% in Q2 FY2026. Management retired $1.35B of the $2B spin-off debt in 10 months, flipping a $419M net debt position into $889M net cash. Q2 revenue of $3.03B crushed the $2.67B consensus by 13.5%.
- Lockup expires March 19 (4 days away). Approximately 850K+ insider shares worth $560M+ become eligible for sale. Multiple Rule 144 pre-sale notices have been filed. Zero insider open-market purchases since the February 2025 spin-off.
- Valuation is stretched on every metric except forward P/E. The forward P/E of 7.87x looks cheap but is based on peak earnings estimates of ~$84/share. If margins mean-revert — as they always do in memory cycles — true forward multiple is 16–26x. EV/Sales of 10.86x is 3–4x what Micron and Western Digital trade at.
- Wait for $400–450. A pullback to the 61.8% Fibonacci retracement of the CES move ($441) or the earnings gap fill ($454–473) would create a compelling entry with 20–40% upside and limited additional downside.
| Report | Signal | Key Finding | Weight |
|---|---|---|---|
| Fundamentals | BULLISH | Forward P/E 7.87x, PEG 0.04. Revenue +61% YoY. Gross margin 7% to 51%. Current ratio 3.56, D/E 0.08. Pristine balance sheet. | 25% |
| SEC Filings | BULLISH | Debt paydown $2B to $650M in 10 months. $889M net cash. $1.5B OCF in H1 FY26. Datacenter +195% YoY. | 20% |
| Technical | MIXED | All MAs in “golden stack” alignment. RSI 58.65. MACD bullish crossover imminent. BUT: 202% above 200-day MA, beta 5.48, ATR $50/day. | 15% |
| News & Events | BULLISH | 75+ articles in Q1 2026, 80%+ bullish. Analyst PTs: Goldman $700, Bernstein $1,000, consensus $777.80. | 15% |
| Insider/Institutional | BEARISH | Zero insider purchases. Two open-market sales. Lockup expires Mar 19. Institutional ownership -4.25% QoQ. Druckenmiller exited. | 15% |
| Sentiment | BULLISH | Overwhelmingly bullish Reddit/Twitter. Jensen Huang “largest unserved market” catalyst dominant. Crowded consensus = contrarian warning. | 10% |
| COMPOSITE | HOLD | 4 bullish, 1 mixed, 1 bearish across 6 reports. Fundamentals are strong but the stock price has outrun the thesis. Risk/reward unfavorable at current levels. | 100% |
Investment Thesis
Sandisk Corporation spun off from Western Digital on February 21, 2025 and has appreciated 2,272% in 13 months — from a post-spin low of $27.89 to $661.62. The company is riding a genuine NAND flash supercycle fueled by AI infrastructure demand, and CEO David Goeckeler has executed brilliantly since independence. At CES 2026, Jensen Huang declared storage the “largest unserved market” in AI, and Nvidia’s Rubin architecture creates massive incremental NAND demand through KV cache offloading to SSDs.
The bull case rests on three pillars: (1) TrendForce warns NAND shortage will persist through 2027, (2) Sandisk developed High Bandwidth Flash (HBF) — a proprietary memory architecture combining NAND and HBM characteristics, with an MoU signed with SK hynix to standardize under OCP, and (3) Q2 FY2026 earnings demolished estimates with $3.03B revenue (vs. $2.67B consensus) and $6.20 adjusted EPS (vs. $3.49 estimate).
However, NAND is inherently cyclical. The same dynamics that drove margins from 7% to 51% can reverse rapidly. In November 2025, the stock crashed 35% ($284 to $183) in a single week during a confirmed uptrend. With a beta of 5.48 (among the highest in the S&P 500), a 10% market correction implies a 55% SNDK drawdown. Druckenmiller exited after one quarter with triple-digit returns. Citron Research initiated a short. A pullback to $400–450 would create the risk/reward setup I need to get long.
SNDK Fundamental Analysis
Sandisk operates as a single reportable segment in NAND flash storage, with revenue disaggregated by end market: Datacenter (formerly Cloud), Edge (formerly Client), and Consumer. The company has ~11,000 employees across 33 countries and manufactures primarily through its Flash Ventures joint venture with Kioxia.
Revenue & Profitability
| Metric | FY2023 | FY2024 | FY2025 | Q1 FY26 | Q2 FY26 |
|---|---|---|---|---|---|
| Revenue ($M) | $6,086 | $6,663 | $7,355 | $2,308 | $3,025 |
| Gross Profit ($M) | $430 | $1,072 | $2,212 | $687 | $1,541 |
| Gross Margin | 7.1% | 16.1% | 30.1% | 29.8% | 50.9% |
| Operating Income ($M) | ($1,364)* | ($468) | $453** | $176 | $1,065 |
| EPS (GAAP) | ($14.78) | ($4.63) | ($11.32) | $0.77 | $5.46 |
*FY2023 ex-$671M goodwill impairment. **FY2025 ex-$1.83B goodwill impairment. GAAP net income remains negative due to non-cash impairment charges.
Quarterly Revenue Progression by Segment ($M)
| Segment | Q2 FY25 | Q3 FY25 | Q4 FY25 | Q1 FY26 | Q2 FY26 |
|---|---|---|---|---|---|
| Datacenter | $250 | $197 | $213 | $269 | $440 |
| Edge | $1,028 | $927 | $1,103 | $1,387 | $1,678 |
| Consumer | $598 | $571 | $585 | $652 | $907 |
| Total | $1,876 | $1,695 | $1,901 | $2,308 | $3,025 |
Valuation & Peer Comparison
| Company | Mkt Cap | Fwd P/E | EV/Sales | Gross Margin | 1-Yr Return |
|---|---|---|---|---|---|
| SNDK (Sandisk) | $97.7B | 7.87x | 10.86x | 50.9% (Q2) | +1,266% |
| MU (Micron) | ~$470B | ~12x | ~3x | ~40% | +300% |
| WDC (Western Digital) | ~$40B | ~8x | ~2x | ~35% | +200% |
| STX (Seagate) | ~$80B | ~15x | ~3x | ~35% | +280% |
EPS Trajectory
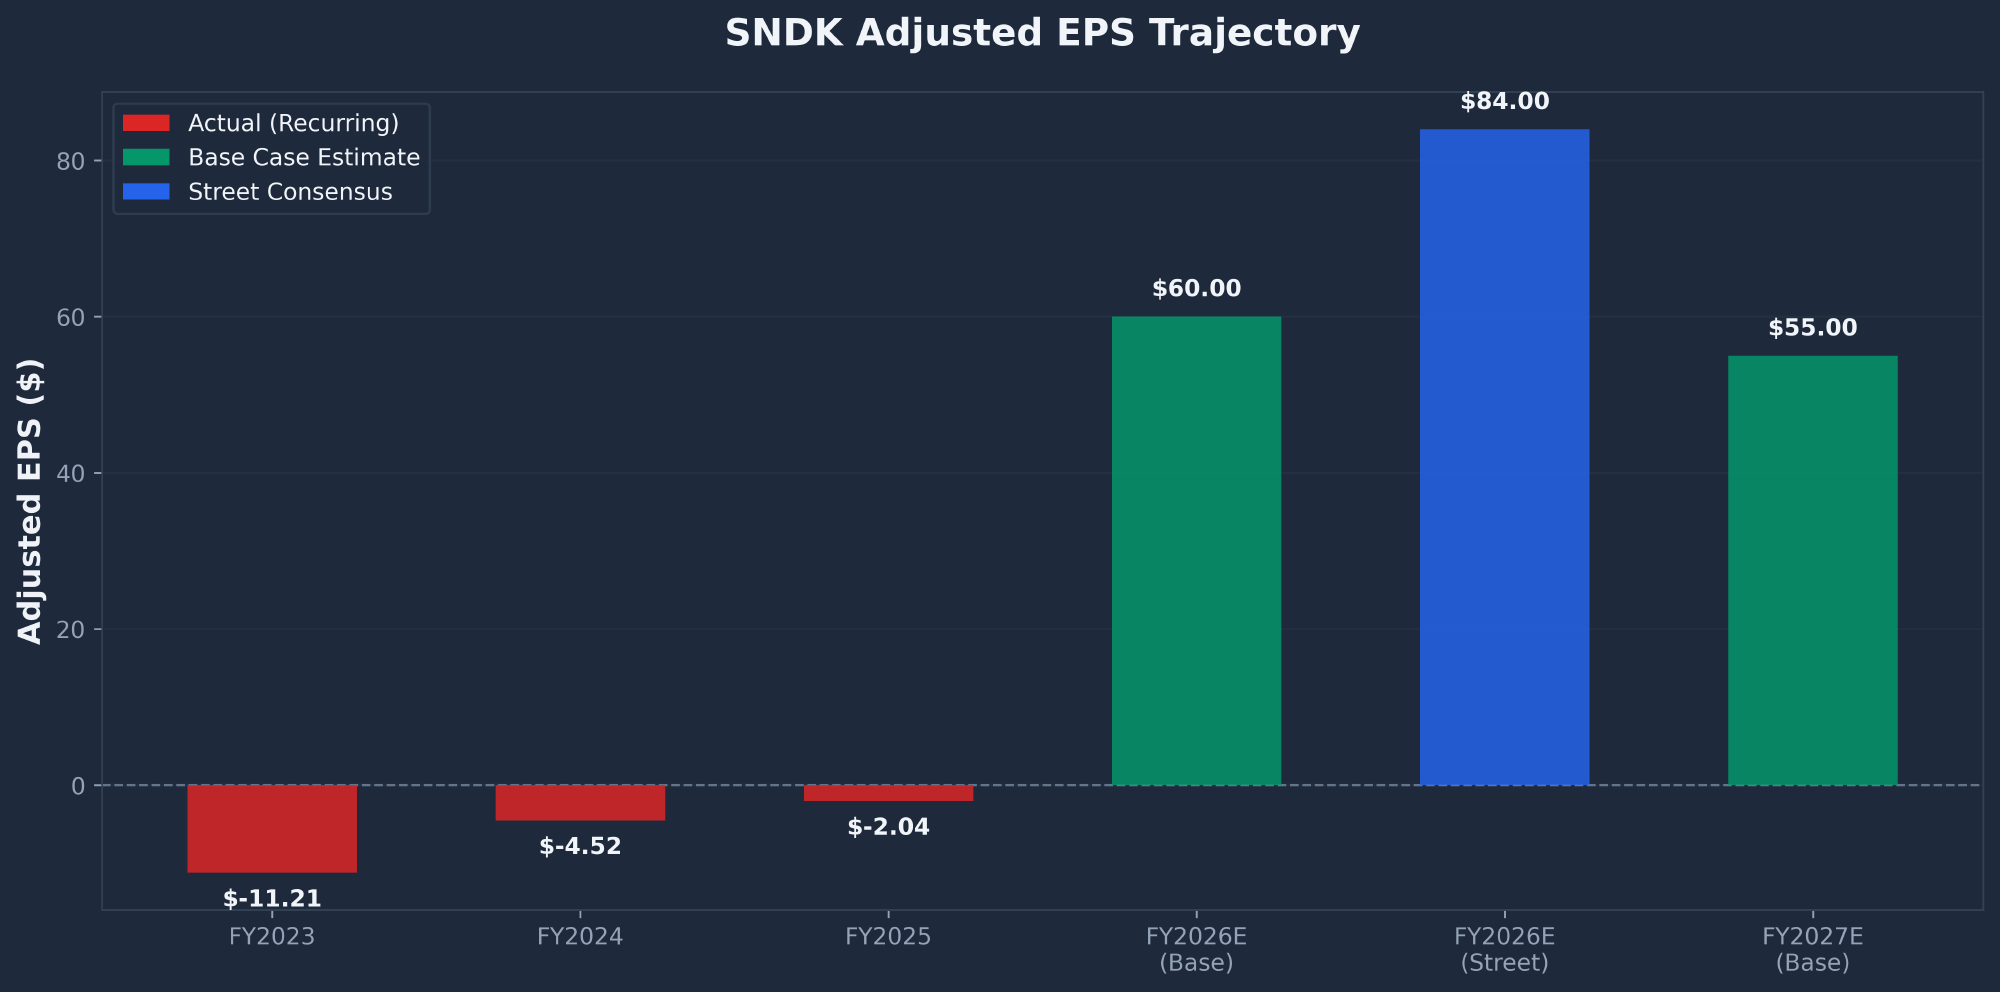
Street consensus of ~$84 EPS for FY2026 implies roughly the bull case scenario, which the market is currently pricing as the base case. The forward P/E of 7.87x looks cheap, but memory stocks historically trade at 8–12x peak earnings and 15–20x trough earnings. The market knows peak earnings are unsustainable.
SNDK Technical Analysis
Moving Average Stack
| Moving Average | Value | Price vs MA | Signal |
|---|---|---|---|
| SMA 10 | $602 | +9.9% | Bullish |
| SMA 50 | $530.52 | +24.7% | Bullish — not closed below since Sep 2025 |
| SMA 200 | $219.12 | +201.9% | Extreme extension — 8-sigma anomaly |
| EMA 10 | $618.30 | +7.0% | Bullish — reclaimed on Mar 8 V-bounce |
All moving averages are in perfect bullish “golden stack” alignment (SMA 10 > SMA 20 > SMA 50 > SMA 200) and all rising. RSI (14) at 58.65 is neutral-bullish with room to run before overbought (70+). The RSI never reached deeply oversold territory during the $725-to-$517 correction — a hallmark of a strong uptrend. MACD histogram has narrowed from -19.70 (Feb 28) to -3.15 (Mar 13), with a bullish crossover expected within 1–3 sessions.
Key Support & Resistance Levels
| Level | Price | Significance |
|---|---|---|
| R3 — ATH | $725 | All-time high (Feb 2). Breakout above on volume = extremely bullish. |
| R2 — Feb 22 High | $692 | $692.50 call block. Psychological $700 resistance. |
| R1 — Recent High | $672 | Mar 12 intraday high. First hurdle to clear. |
| S1 — EMA 10 / Fib 23.6% | $617–618 | Confluence zone. Held on Mar 11 pullback. |
| S2 — SMA 50 / Fib 38.2% | $527–550 | STRONG confluence. Mar 5 low bounced hard here. |
| S3 — V-Bounce Low | $517 | STRONG. Mar 8 intraday low. Launched +$145/+28% rally in 4 days. |
| S4 — Earnings Gap Fill | $454–473 | Jan 26 weekly low. Gap from Q2 earnings. |
| S5 — Fib 61.8% (CES) | $441 | Golden ratio retracement of CES move. Ideal entry zone. |
The stock is consolidating in a $517–$725 range (40% wide). The $725-to-$517 correction (~28.6% pullback) held above the 38.2% Fibonacci retracement of the CES move, which maintains bullish trend structure. However, trading at +202% above the SMA 200 with a beta of 5.48 and an ATR of $50/day, this stock is not suitable for tight stops. Position sizing is the most important technical consideration.
SEC Filings Deep Dive
I reviewed 17 SEC filings spanning January 2025 through January 2026 (CIK: 0002023554), including the S-1 registration, 10-K, four 10-Qs, proxy statement, and ten 8-Ks. The filings reveal a dramatic transformation: within 10 months of independence, management turned cumulative $4.5B in losses over three years into a cash-generating powerhouse.
Debt Paydown & Balance Sheet Transformation
| Metric | Spin-off (Feb 2025) | FY2025 End (Jun 2025) | Q2 FY2026 (Jan 2026) |
|---|---|---|---|
| Term Loan B | $2,000M | $1,900M | $650M |
| Cash & Equivalents | ~$500M (est.) | $1,481M | $1,539M |
| Net Position | Net Debt $1,500M | Net Debt $419M | Net Cash $889M |
| Undrawn Revolver | $1,500M | $1,500M | $1,500M |
| Total Liquidity | — | $2,981M | $3,039M |
Management Credibility Scorecard
| Promise | Status |
|---|---|
| Successful separation from WDC | DELIVERED |
| $1.5B net distribution to WDC | DELIVERED |
| NAND demand to outpace supply through CY2026+ | DELIVERED |
| K2 fab output in H1 2026 | IN PROGRESS |
| WDC to divest remaining 5.1% stake | IN PROGRESS |
Overall Management Credibility: HIGH. CEO David Goeckeler ($22.9M total comp, heavily weighted toward performance-contingent equity) has delivered on every measurable promise since spin-off.
Off-Balance Sheet Risks
News & Catalysts
SNDK was one of the most-discussed stocks in Q1 2026 with 75+ articles across 15+ sources. The Motley Fool alone published 20+ dedicated SNDK articles. Coverage is 80%+ bullish, with the AI-driven NAND supercycle narrative dominating.
Analyst Ratings & Price Targets
| Firm | Price Target | Date |
|---|---|---|
| Bernstein | $1,000 | Jan 30, 2026 |
| UBS | $1,000 | Jan 30, 2026 |
| Cantor | $800 | Jan 30, 2026 |
| Raymond James | $725 | Jan 30, 2026 |
| Goldman Sachs | $700 | Feb 9, 2026 |
| Morgan Stanley | $690 | Jan 30, 2026 |
| RBC Capital | $400 | Jan 15, 2026 |
| Consensus Average | $777.80 | +17.6% upside |
Upcoming Catalysts
| Date | Event | Impact |
|---|---|---|
| Mar 19, 2026 | Lockup Expiration — insiders free to sell ~$560M+ in shares | HIGH |
| May 2026 | Q3 FY2026 Earnings — guidance set $4.4–4.8B rev / $12–14 EPS bar | HIGH |
| Q2 2026 | TrendForce NAND pricing data — continued 50–100% hikes vs. deceleration | HIGH |
| H2 2026 | WDC remaining 5.1% stake divestiture | MEDIUM |
| TBD 2026 | HBF commercial product launches — potential $2–3B new revenue stream | MEDIUM |
| Late 2026 | YMTC/CXMT capacity ramp (China) — oversupply risk | HIGH |
Market Sentiment
Internet sentiment for SNDK is strongly bullish with high chatter volume across Reddit and Twitter/X. The three dominant catalysts driving discussion are Jensen Huang’s CES declaration, the NAND supercycle/shortage narrative, and High Bandwidth Flash (HBF) technology. However, overwhelmingly bullish consensus is itself a contrarian warning.
Bull Arguments
- AI memory infrastructure play — “GPUs without storage are useless.” Only pure-play U.S. NAND manufacturer.
- NAND supply shortage through 2027+ — Goldman projects NAND pricing +100–120% in 2026.
- HBF is a moat — 8–16x capacity of HBM at flash-class cost. SK hynix MoU validates.
- Forward P/E of 7.87x — PEG 0.04 with EPS estimates rising from $20 to $84.
- Nvidia certification — Gen5 eSSDs certified for datacenter, now in vendor chain.
Bear Arguments
- Chinese competition (YMTC/CXMT) — CXMT DDR5 factory reportedly coming online late winter 2026.
- Citron Research short — Hype “could vanish in a single earnings call.”
- Parabolic run = cyclical risk — Up 2,200% with 5.48 beta. 35% weekly drawdown precedent.
- $1.14M put block at $630 — Institutional bearish conviction near term.
- WDC $3.17B secondary — Ongoing selling pressure from former parent.
Reddit Activity by Subreddit
| Subreddit | Activity | Tone |
|---|---|---|
| r/wallstreetbets | HIGH (7+ posts) | Strongly Bullish |
| r/stocks | MEDIUM-HIGH (7 posts) | Bullish with debate |
| r/investing | MEDIUM (7 posts) | Curious, some FOMO |
| r/ValueInvesting | MEDIUM (7 posts) | Cautiously bullish |
Insider & Institutional Activity
Top 10 Institutional Holders
| Institution | % Owned | Est. Shares (M) | Est. Value |
|---|---|---|---|
| FMR LLC (Fidelity) | 14.65% | 21.68 | $14.34B |
| Vanguard Group | 11.58% | 17.14 | $11.34B |
| BlackRock, Inc. | 6.57% | 9.72 | $6.43B |
| State Street Corp | 3.60% | 5.33 | $3.53B |
| Arrowstreet Capital | 2.37% | 3.51 | $2.32B |
| D. E. Shaw & Co. | 1.43% | 2.12 | $1.40B |
| Norges Bank (Norway SWF) | 1.49% | 2.21 | $1.46B |
Smart money signal: Fidelity’s 14.65% active position represents fundamental conviction in SNDK’s standalone value. D.E. Shaw and Arrowstreet Capital (two of the most sophisticated quant hedge funds) hold a combined ~3.8%. The Norwegian sovereign wealth fund at 1.49% provides stable, long-term capital. However, Druckenmiller dumped his entire position after one quarter with triple-digit returns, and institutional transactions show a net -4.25% QoQ reduction — profit-taking after the parabolic run.
Risk Factors
| Risk | Prob. | Impact | Details |
|---|---|---|---|
| NAND Pricing Mean Reversion | HIGH | SEVERE | NAND prices surged 500% from trough. Gross margins swung from 7.1% to 50.9% — they will swing back. Q1 FY26 already showed 9–11% ASP declines before re-accelerating. |
| Lockup Expiration (Mar 19) | HIGH | MOD | 850K+ insider shares worth $560M+. Multiple Rule 144 pre-filings. Zero insider purchases ever. Near-certainty selling event. |
| Chinese NAND Competition | MED | SEVERE | CXMT DDR5 factory reportedly coming online late winter 2026. Chinese overcapacity could crater consumer/edge NAND pricing. |
| Kioxia Single-Source | LOW | SEVERE | ~80% of manufacturing via Flash Ventures. Contractually prohibited from manufacturing elsewhere. $3.4B annual wafer commitments. |
| Market Correction / Beta | MED | SEVERE | Beta 5.48: a 10% S&P correction implies 55% SNDK drawdown. 35% weekly drawdown precedent (Nov 2025). 202% above 200-day MA. |
| China Revenue Exposure | MED | MOD | 28% of FY2025 revenue ($2.04B) from China. Any U.S.–China tech restriction escalation could impair significant revenue. |
| $5B Goodwill Impairment | MED | MOD | 38% of total assets. Already written down $2.5B in FY2023 and FY2025. Further impairment risk in any downturn. |
Thesis-Breaker Price: $400. A sustained break below $400 signals NAND pricing has peaked and the cyclical downturn has begun. At that level, the stock trades at ~7x bear-case FY2027 EPS with further downside likely.
SNDK Price Targets & Conclusion
Earnings Model — Three Scenarios
| Metric | Bear | Base | Bull |
|---|---|---|---|
| FY2026E Revenue | $12.5B | $14.5B | $16.0B |
| FY2027E Revenue | $10.0B | $15.5B | $20.0B |
| FY2027E Gross Margin | 25% | 42% | 48% |
| FY2027E EPS | $25 | $55 | $95 |
| Applied P/E Multiple | 12x | 10x | 10x |
| Fair Value | $300 (-55%) | $550 (-17%) | $950 (+44%) |
Bull Case ($950)
- NAND undersupply extends through CY2028
- HBF becomes standardized, adds $2–3B revenue at 50%+ margins
- Q3 beats $4.4–4.8B guidance, raises FY outlook
- Long-term supply agreements lock in hyperscaler revenue
- $95 EPS at 10x = $950
Bear Case ($300)
- NAND pricing peaks mid-2026, declines 30–40% by FY2027
- YMTC/CXMT capacity ramp craters pricing
- Margins revert to 25% (still above FY2024 trough)
- $5B goodwill takes another impairment
- $25 EPS at 12x = $300
Position Sizing & Action Plan
| Parameter | Recommendation |
|---|---|
| New Positions | 0% allocation. Wait for $400–450 entry where risk/reward flips favorable. Consider selling cash-secured puts at the $400 strike to get paid while waiting. |
| If Already Long | Trim 50% into current strength. Let remaining 50% ride with trailing stop at $500 (below March V-bounce low). Protects against lockup and cyclical turn while maintaining upside. |
| Entry Strategy | Fib 61.8% retracement = $441. Earnings gap fill = $454–473. At those levels: base-case upside 20–40% with limited additional downside. Set alerts and be patient. |
| Alternative | For NAND exposure at lower risk, consider Micron (MU) at ~3x EV/Sales vs. SNDK’s 10.86x. Same supercycle thesis at one-third the valuation multiple. |
| Stop-Loss | $500 (hard stop) — below March V-bounce low ($517) and SMA 50 ($530). Close below $500 signals breakdown. |
| Profit Target | $725–750 — take another 25% off at ATH retest. If stock breaks above $725 on volume, reassess (bullish continuation with no overhead supply). |
If you are looking to build a position in SNDK at lower levels, consider options strategies such as the wheel strategy or selling puts to lower your cost basis. On this website, I cover options-based approaches to high-conviction stock ideas like SNDK. For more stock research, see the stock analysis section including my recent STX (Seagate) analysis, which covers a related storage play in the same AI-driven cycle.
Frequently Asked Questions
Is SNDK a good stock to buy?
SNDK is a great business but not a great buy at $661.62. The forward P/E of 7.87x appears cheap, but it’s based on peak earnings estimates that assume NAND margins stay at 50%+ for years. EV/Sales of 10.86x is 3–4x what peers trade at. With a beta of 5.48, lockup expiration on March 19, and a 35% weekly drawdown precedent, the risk/reward is unfavorable. I would become an aggressive buyer at $400–450 where the Fibonacci retracement and earnings gap fill create a compelling entry.
What is the SNDK price target for 2026?
My base-case 12-month price target is $550, implying 17% downside from current levels. The bear case is $300 (if NAND margins revert to 25%), and the bull case is $950 (if the supercycle extends through 2028 and HBF commercializes). Wall Street consensus is $777.80, with individual targets ranging from RBC’s $400 to Bernstein’s $1,000.
Should I buy or sell SNDK?
If you have no position: do not buy at current levels. Wait for $400–450. If you are already long: trim 50% into current strength, set a trailing stop at $500 on the remaining position, and take another 25% off at a $725 ATH retest. The stock has appreciated 2,272% from its post-spin-off low — protecting profits is paramount.
SNDK stock forecast for 2026 and beyond?
Near term (Q2 2026): expect volatility around the March 19 lockup expiration and May earnings. The stock’s 5.48 beta and $50/day ATR mean 20%+ swings in either direction are normal. Medium term (2026–2027): the NAND supercycle has 12–18 months of runway if Goldman’s shortage thesis holds, but memory cycles always end. SNDK’s HBF technology could create a structural new demand tier for AI inference, but commercial products are still in development. Long term (2028+): China’s NAND capacity additions (YMTC, CXMT) and eventual supply normalization will pressure margins back toward the historical 20–30% range.
Sources: SEC Filings (EDGAR), Finviz Elite, Polygon.io, Google News, Reddit, Twitter/X, Goldman Sachs, TrendForce, Seeking Alpha. Report compiled March 15, 2026.