STX (Seagate) Stock Analysis: Buy at $384 | $475 Target
Table of Contents
Executive Summary
This STX stock analysis covers Seagate Technology's fundamentals, technicals, SEC filings, market sentiment, and insider activity as of March 2026. Here is the bottom line:
- BUY on the 16.6% pullback from ATH. STX is a cyclical stock in a structural AI-driven upcycle with a genuine technology moat (HAMR). The correction has brought the forward P/E to 19.5x with a PEG of 0.43 — cheap for 45%+ projected EPS growth.
- HAMR first-mover advantage is real and quantifiable. Seagate is the sole HDD manufacturer shipping heat-assisted magnetic recording (HAMR) drives at scale (44TB Mozaic 4+). This technology lead translates directly into premium ASPs, 41%+ gross margins, and sold-out capacity through 2026.
- The balance sheet is the biggest risk. Negative equity (-$453M), $5.37B in debt including $1.7B at crisis-era rates (8-9.6%), and $1B of deeply in-the-money convertible notes create financial fragility. A demand downturn at these leverage levels would be painful.
- Insiders are selling everything, but institutions are buying aggressively. 130 sales vs. 1 purchase over 5 years is alarming — but all top 10 institutional holders added in Q4 2025, with Aequim adding $175M. Smart money is concentrating while insiders take profits via mechanical 10b5-1 plans.
- Position sizing matters. This is a high-beta (1.67), high-volatility cyclical with extreme upside and downside scenarios. The recommendation is a moderate-conviction BUY with strict position sizing and defined stop-loss levels.
| Report | Signal | Key Finding | Weight |
|---|---|---|---|
| Fundamentals | BULLISH | Record margins (38.65% GM), $1.675B FCF, Fwd P/E 19.5x, PEG 0.43 | 25% |
| SEC Filings | MIXED | HAMR delivered, dividend maintained. Red flags: negative equity, crisis debt, BIS settlement | 20% |
| Technical | NEUTRAL | 16.6% correction reset RSI to 49.7. Sitting on SMA 50 support ($374). MACD bearish but improving. | 15% |
| News & Events | BULLISH | 22 bullish vs 9 bearish articles. HAMR shipping, analyst upgrades to $475-$500 | 15% |
| Insider/Institutional | BEARISH | 130 sales, 1 purchase in 5 years. But top 10 institutions all added in Q4 2025. | 15% |
| Sentiment | BULLISH | AI storage supercycle narrative dominant. STX least discussed of 4 storage names — room for discovery. | 10% |
| COMPOSITE | MODERATELY BULLISH | 4 bullish, 1 neutral, 1 bearish across 6 reports. Weighted composite favors the long side with elevated risk. | 100% |
Investment Thesis
Seagate Technology is in the early-to-middle innings of an AI-driven storage supercycle that is fundamentally different from prior HDD demand waves. The company's HAMR technology — commercially deployed via the Mozaic 4+ platform at 44TB — gives it a multi-year capacity lead over Western Digital (WDC), which is still shipping conventional PMR drives and does not expect to have competitive HAMR volume until H2 2026 at the earliest. In a duopoly market where demand from hyperscalers (AWS, Google, Microsoft) is growing approximately 40% annually while supply remains constrained, Seagate holds genuine pricing power. Management has stated that orders are fully booked through 2026 with visibility into 2028, and the CFO recently confirmed that demand continues to outpace supply.
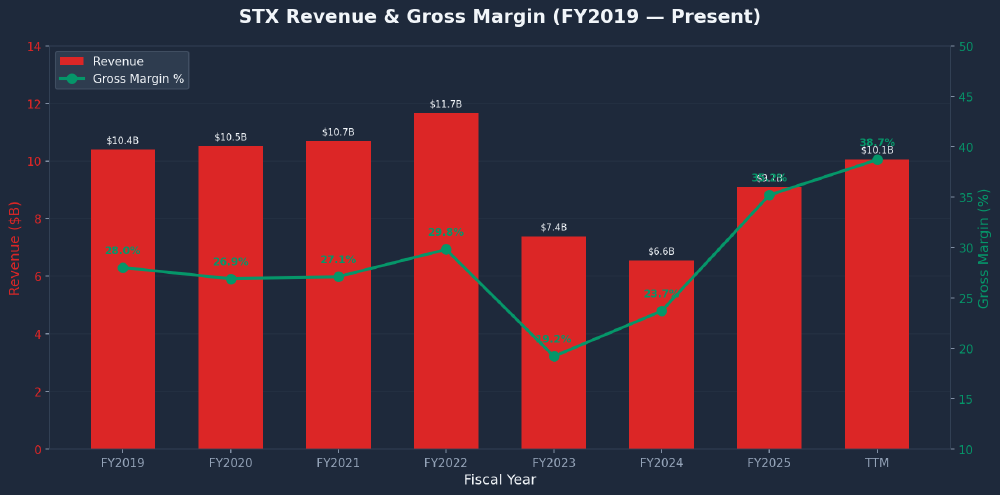
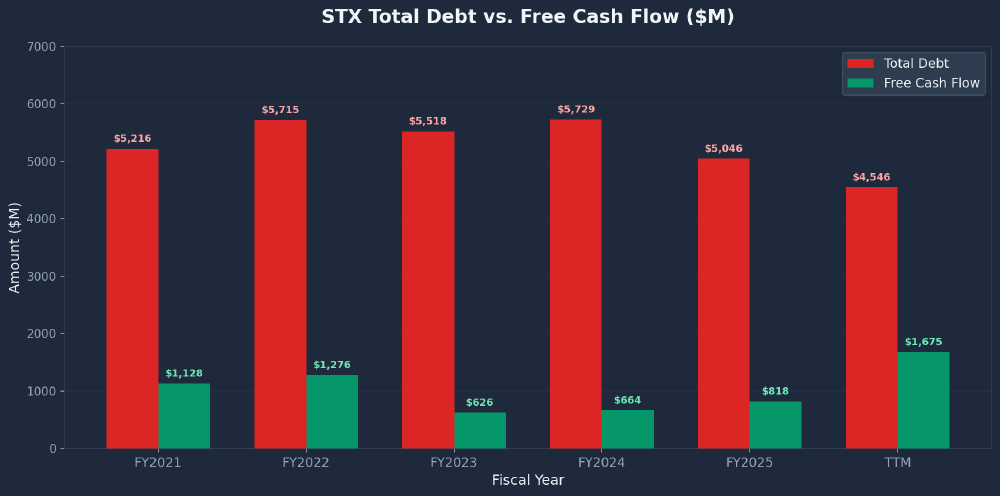
The financial profile supports the thesis. Gross margins have expanded from a cyclical trough of 18% (FY2023) to a record 41% in the most recent quarter — well above the company's historical 27-30% range. This is not a simple cyclical bounce; HAMR drives command premium ASPs, and the mix shift toward high-capacity nearline enterprise drives is structurally margin-accretive. TTM free cash flow has surged to $1.675B, up 105% from FY2025's $818M, and the company is using the cash flow to deleverage, having repaid $1.578B in debt versus $400M issued.
The 16.6% pullback from the $459.84 ATH creates the entry opportunity. The correction was triggered by the $600M convertible note exchange (5.95M new shares, ~2.8% dilution) and post-earnings profit-taking — not a deterioration in fundamentals. The risk/reward setup favors a bounce toward $475 over the next 12 months, contingent on Q3 FY2026 earnings confirming the growth trajectory.
The key risk for STX stock is that this is, at its core, a deeply cyclical business with extreme revenue volatility ($11.7B to $6.6B to $10B in three years) and a leveraged balance sheet. The 43x trailing P/E leaves no room for a guidance miss. But with a properly sized position, defined stop levels, and the structural tailwind of AI data infrastructure spending, the asymmetry favors the long side at $383.71.
Fundamental Analysis
Company Overview
Seagate Technology Holdings PLC is one of the world's largest manufacturers of hard disk drives (HDDs), providing data storage solutions for enterprise, cloud, and consumer markets. Domiciled in Ireland with principal operations in the US and Asia, Seagate employs approximately 30,000 people. The company is a component of both the S&P 500 and Nasdaq 100 indices and is a pure-play HDD manufacturer, differentiating from rival Western Digital which also makes NAND flash.
Seagate has benefited from the AI-driven surge in demand for high-capacity enterprise drives. The company's HAMR technology enables 30TB+ drives that dramatically lower $/TB for data centers. Revenue has rebounded strongly from the FY2023-FY2024 cyclical trough, with TTM revenue reaching $10.06B and gross margins expanding to 38.65% — the highest in the company's recent history.
Income Statement
| Metric ($M) | TTM | FY25 | FY24 | FY23 | FY22 | FY21 |
|---|---|---|---|---|---|---|
| Revenue | 10,058 | 9,097 | 6,551 | 7,384 | 11,661 | 10,681 |
| Gross Profit | 3,887 | 3,200 | 1,552 | 1,417 | 3,469 | 2,891 |
| Net Income | 1,970 | 1,469 | 335 | (529) | 1,649 | 1,314 |
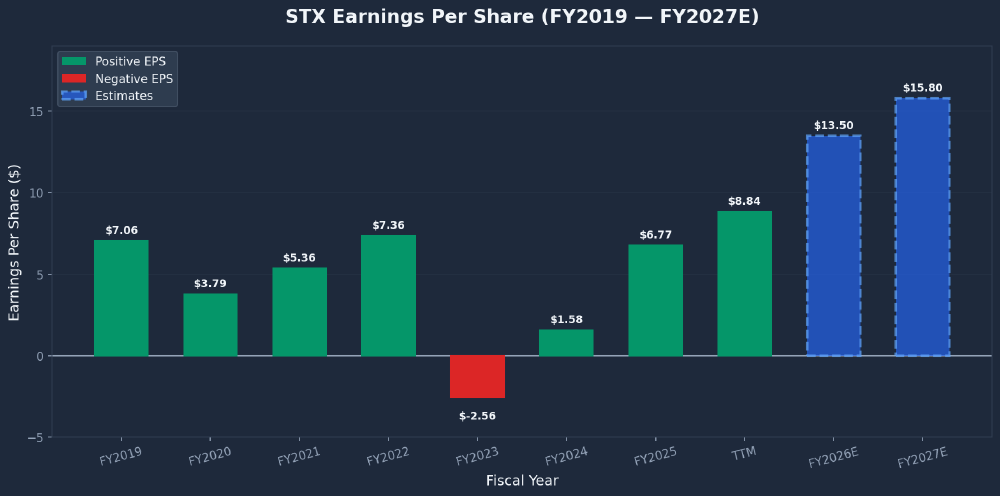
| EPS (Diluted) | $8.84 | $6.77 | $1.58 | ($2.56) | $7.36 | $5.36 |
| Gross Margin | 38.65% | 35.18% | 23.69% | 19.19% | 29.75% | 27.07% |
| Operating Margin | 25.60% | 21.05% | 6.69% | 1.75% | 16.89% | 13.91% |
EPS Trajectory
Valuation Snapshot
| Metric | Value | Metric | Value |
|---|---|---|---|
| P/E (TTM) | 43.39x | Forward P/E | 19.53x |
| PEG Ratio | 0.43 | EV/EBITDA | 30.80x |
| P/S (TTM) | 8.32x | P/FCF | 49.96x |
| Dividend Yield | 0.76% | Analyst Target | $485.05 |
| EPS Growth (Y/Y) | +65.02% | EPS Next 5Y CAGR | +45.70% |
| ROA | 23.64% | ROIC | 46.19% |
Balance Sheet & Leverage
| Balance Sheet ($M) | FY25 | FY24 | FY23 | FY22 |
|---|---|---|---|---|
| Cash & Equivalents | 893 | 1,360 | 788 | 617 |
| Long-Term Debt | 5,312 | 5,533 | 5,721 | 5,098 |
| Total Equity | ($453) | ($1,491) | ($1,199) | 109 |
| Free Cash Flow | 818 | 664 | 626 | 1,276 |
Peer Comparison
| Metric | STX ($384) | WDC ($272) | MU ($426) |
|---|---|---|---|
| Market Cap | ~$84B | ~$38B | ~$470B |
| Forward P/E | 19.5x | ~18x | ~22x |
| PEG | 0.43 | ~0.65 | ~0.75 |
| Gross Margin | 38.7% | ~32% | ~38% |
| Rev Growth (YoY) | +25% | +42% | +38% |
| HAMR Tech | Shipping (44TB) | H2 2026 (target) | N/A (DRAM/NAND) |
Technical Analysis
Technical Summary
STX is in a pronounced correction after surging 628% from $63.19 to $459.84 in roughly 10 months. The stock currently sits at $383.71, down 16.6% from its all-time high. All major moving averages remain bullishly stacked with price well above the SMA 200 ($244.78, +56.8%), confirming the long-term uptrend is intact. However, the short-term picture is mixed: RSI has reset to a neutral 49.7, MACD remains in bearish territory (line at -2.63, below signal), and the stock is trading below its SMA 20.
| Indicator | Value | Signal |
|---|---|---|
| SMA 10 | $373.46 | BULLISH (+2.7%) |
| SMA 20 | ~$392.96 | BEARISH (-2.4%) |
| SMA 50 | $374.45 | BULLISH (+2.5%) |
| SMA 200 | $244.78 | BULLISH (+56.8%) |
| RSI (14) | 49.73 | NEUTRAL |
| MACD | -2.63 / Signal: 0.64 | BEARISH (improving) |
| Beta | 1.67 | HIGH VOLATILITY |
| ATR (14) | $24.96 | ~6.5% daily range |
Support & Resistance Levels
| Support | Price | Significance |
|---|---|---|
| S1 | $374-$375 | SMA 50 + bounce zone. Immediate support. |
| S2 | $342 | Swing low (Mar 10). Must hold for bullish structure. |
| S3 | $296-$308 | 38.2% Fib + prior breakout zone. Major support. |
| S4 | $245-$262 | 50% Fib + SMA 200 confluence. Major structural support. |
| Resistance | Price | Significance |
|---|---|---|
| R1 | $393-$398 | SMA 20 + recent range high. Must clear for uptrend resumption. |
| R2 | $425-$432 | Prior consolidation zone. Heavy overhead supply. |
| R3 | $445-$460 | ATH zone at $459.84. Major psychological and structural resistance. |
Chart Patterns
The stock completed a parabolic blowoff top pattern in late January/early February, surging from $160 to $460 in 6 months before reversing sharply. Historically, parabolic stocks retrace 38-62% of their advance. A descending channel is active since the ATH, with lower highs ($460 → $427 → $408 → $398) and lower lows ($394 → $374 → $350 → $342). The Mar 10 hammer candle at $342 showed strong buying at lows (opened $342, closed $374, +9.4% off lows) but needs confirmation above $398.
SEC Filings Deep Dive
Analysis of 96 SEC filings spanning 5 years (FY2021-FY2026): 5 annual reports (10-K), 15 quarterly reports (10-Q), 71 current reports (8-K), and 5 proxy statements (DEF 14A).
Management Credibility Scorecard
| Promise | Result |
|---|---|
| HAMR technology to reach volume production | DELIVERED |
| CapEx target of 4-6% of revenue | DELIVERED |
| Maintain dividend through the cycle | DELIVERED |
| Export compliance ("robust compliance program") | FAILED ($300M BIS fine) |
| Operational efficiency & cost reduction | DELIVERED |
| Debt management & leverage reduction | MODERATE |
Overall Management Credibility: MODERATE-HIGH. Dave Mosley has served as CEO throughout the entire 5-year period. Management delivered on the critical HAMR bet, maintained the dividend through a severe downturn, and cut the workforce 25% (40,000 to 30,000). The BIS violation ($300M penalty for shipping to Huawei) was a serious lapse, but the company has since invested in compliance infrastructure.
Debt Maturity Schedule
| Period | Amount ($M) | Notes |
|---|---|---|
| FY2026-2027 | $0 | No near-term maturities |
| FY2028 | $1,000 | 3.50% Exchangeable Notes (deeply in-the-money at ~$82 conversion) |
| FY2029 | $470 | Mixed notes |
| FY2030 | $638 | 5.875% notes + others |
| Thereafter | $2,438 | Notes due 2031-2034 at 3.375% to 9.625% |
| Total | $4,546 |
Key SEC Filing Findings
News & Catalysts
STX has received extremely high media coverage over the past 30 days: 45+ articles tracked from Google News and 50 from financial data terminals. Sentiment skews bullish at 22 bullish vs. 9 bearish articles.
Key Headlines
| Date | Headline | Sentiment |
|---|---|---|
| Mar 15 | STX hits record highs amid HAMR momentum and analyst upgrades | Bullish |
| ~Mar 2 | Seagate begins shipping 44TB hard drives with HAMR tech to data centers (Tom's Hardware) | Bullish |
| ~Mar 2 | Seagate: From Cyclical Hardware To AI Infrastructure Story (Seeking Alpha — Strong Buy) | Bullish |
| Feb 26 | Prediction: This Overlooked AI Infrastructure Stock Could Double in 2026 (Motley Fool) | Bullish |
| ~Feb 24 | Seagate pays $599M cash + 5.95M shares in $600M note swap (Stock Titan) | Bearish |
| Jan 28 | Q2 FY2026 earnings: EPS $3.11 vs $2.83 est, revenue $2.83B (+22% YoY), GM 42.2%. Stock surged 19%. | Bullish |
Analyst Ratings & Targets
| Firm | Rating | Price Target | Notes |
|---|---|---|---|
| TD Cowen | Buy | $500 | Raised from $340 (Jan 28) |
| BofA | Buy | $400 | Raised from $320 (Jan 20) |
| Goldman Sachs | — | $385 | |
| BNP Paribas | Outperform | $380 | Upgrade (Jan 21) |
| Consensus | Strong Buy (1.70) | $485.05 | +26.4% upside from current |
Upcoming Catalysts
| Catalyst | Timing | Direction |
|---|---|---|
| Q3 FY2026 Earnings (guided $2.9B rev, $3.40 EPS) | Apr/May 2026 | High Volatility |
| HAMR / Mozaic 4+ volume ramp to broader availability | Q2-Q3 2026 | Bullish if on track |
| WDC HAMR competitive launch | H2 2026 | Competitive risk |
| Potential additional convertible note exchanges | TBD | Dilution risk |
Market Sentiment
Overall Sentiment: BULLISH with growing cracks. The AI storage supercycle narrative dominates, but STX is the least discussed of the four memory/storage names on Reddit (behind MU, SNDK, WDC), suggesting it lacks retail momentum. Growing "too late" fatigue is setting in — the most-upvoted comment on r/stocks ("Memory is the play NOW?!") received 1,202 upvotes of skeptical pushback.
Bull Arguments from the Community
- AI storage demand is structural — shortage expected through 2028. Orders fully booked for 2026 with visibility through 2027-2028.
- HAMR (Mozaic 4+) gives 30%+ capacity gains with premium pricing. Gross margins expected above 50%.
- Jensen Huang at CES 2026 called storage the "largest unserved market" with tight supply and surging demand from AI.
- HDD duopoly pricing power with demand growth ~40% annually outpacing supply through 2027.
- BofA raised PT to $400, Goldman to $385, TD Cowen to $500. Motley Fool predicts stock could double in 2026.
Bear Arguments from the Community
- Supply chain bullwhip risk — will reverse when supply catches up. Memory is historically very cyclical.
- Valuation stretched after 342% surge in 12 months. "Too late" fatigue growing among retail.
- $600M convertible note dilution (5.95M new shares). Recent -13% weekly pullback.
- Hyperscaler concentration risk — OpenAI reportedly consuming 40% of worldwide RAM capacity. Capex pullback could demolish the stock.
- "Short opportunity of a lifetime" — some bears argue SSDs will eventually replace HDDs entirely.
Insider & Institutional Activity
Insider Trading: Relentlessly Bearish
The insider picture is as one-sided as it gets: 130 sales and just 1 purchase ($27K) over 5 years. The single purchase was by Ravi Naik in November 2021. Every other transaction has been a sale. Net insider selling exceeds $400M+ over 5 years.
CEO William Mosley sells exactly 20,000 shares on the 1st of every month under a 10b5-1 plan adopted Feb 20, 2025. His holdings have dropped from 605,530 to 395,897 shares (a 35% reduction) while the stock went from ~$87 to $384. CFO Gianluca Romano sold ~$28M+ worth. EVP/CCO Ban Seng Teh has essentially liquidated his entire position (down to just 3,092 shares). All transactions are under 10b5-1 plans, reducing the informational signal — but the complete absence of any discretionary buying is telling.
Institutional Activity: Smart Money Is Concentrating
All top 10 institutional holders increased positions in Q4 2025 — but overall institutional transactions are -2.72%. This means the broader institutional base is distributing while a concentrated group of sophisticated funds are accumulating aggressively.
| # | Institution | Q4 Change | Notes |
|---|---|---|---|
| 1 | Aequim Alternative Investments | +53.85% | #1 top buy. Added $175M. |
| 2 | Susquehanna Advisors | +31.03% | Major quant fund adding aggressively. |
| 3 | Two Sigma Investments | +24.58% | Systematic quant fund. |
| 4 | Sculptor Capital | +23.41% | Event-driven hedge fund. |
| 5 | Vanguard Group | +13.17% | Passive index giant. Rebalancing/inflows. |
Risk Factors
| Risk | Probability | Impact |
|---|---|---|
| Cyclical demand reversal. Revenue collapsed 44% in the last cycle. If AI capex cools, the stock could retrace to $200-250. | MEDIUM | CATASTROPHIC |
| Margin mean-reversion. Seagate has never sustained gross margins above 35% for more than 2-3 quarters. WDC's HAMR launch in H2 2026 could compress pricing. | MEDIUM-HIGH | HIGH |
| Balance sheet fragility. Negative equity, $5.37B debt, $1B convertible notes deeply in the money. Covenants could become binding in a downturn. | LOW-MEDIUM | HIGH |
| Additional dilution. $1B of convertible notes at $82 conversion = ~12.1M potential shares (~5.5% dilution). Further exchanges could repeat the $600M event. | MEDIUM | MODERATE |
| Customer concentration. OEM channel is 80%+ of revenue with one customer consistently >10%. If a single hyperscaler pauses orders, the impact is outsized. | LOW | HIGH |
| BIS settlement / export compliance. $300M penalty with a suspended denial order through ~2028. Any future violation could reactivate the denial order. | LOW | HIGH |
Conclusion & Price Targets
Earnings Model — Three Scenarios
| Bear Case | Base Case | Bull Case | |||||||
|---|---|---|---|---|---|---|---|---|---|
| Metric | FY26E | FY27E | FY28E | FY26E | FY27E | FY28E | FY26E | FY27E | FY28E |
| Revenue ($B) | $10.8 | $10.5 | $9.8 | $11.2 | $12.8 | $13.8 | $11.5 | $14.5 | $16.5 |
| Gross Margin | 38% | 32% | 28% | 40% | 38% | 36% | 42% | 43% | 42% |
| EPS | $10.50 | $6.50 | $4.00 | $13.50 | $15.80 | $16.50 | $14.50 | $21.00 | $24.50 |
Bull Case: $525 (+37%)
- AI data center buildout accelerates through FY2028
- HAMR maintains 12-18 month tech lead
- Demand > supply keeps pricing firm
- Margins hold at 42%+
- $5B buyback shrinks float to ~210M shares
- Crisis-era debt refinanced, saving ~$50M/yr
Bear Case: $158 (-59%)
- AI capex cycle peaks mid-2027
- Hyperscaler order deferrals
- WDC HAMR launch compresses pricing
- Margins revert toward historical 28-30%
- Supply glut develops by FY2028
- Share count rises to 225M from dilution
Action Plan
| Parameter | Recommendation |
|---|---|
| Portfolio Allocation | 3-5% of equity portfolio. High-beta cyclical warrants moderate sizing. |
| Entry Strategy | 50% position at $375-385 (current zone). Add 50% on either (a) confirmed break above $400 on volume, or (b) pullback to $342-350 with RSI < 35. |
| Stop-Loss | Hard stop at $310 (38.2% Fib retracement, ~19% below current). Trail to $375 once stock reclaims $430. |
| Profit Targets | T1: $430-445 (take 25% off). T2: $475 (take 50% off). T3: $525+ (trail remaining 25%). |
| Max Loss | ~19% ($383 to $310 stop) × 5% allocation = ~0.95% of total portfolio. |
| Key Review Dates | Re-evaluate before Q3 FY2026 earnings (Apr/May 2026). Exit entirely if stock breaks below $342 before earnings or if Q3 misses guidance. |
The Bottom Line
This Seagate stock analysis rates STX a moderately-convicted BUY at $383.71 with a 12-month target of $475 (+23.8%). This is not a "buy and forget" stock — it is a high-beta, leveraged cyclical that demands active management, strict position sizing, and a hard stop at $310. The investment case rests on a genuine technology moat (HAMR, sole manufacturer at scale), a structural AI demand tailwind that extends HDD cycle duration beyond historical norms, and a compelling growth-adjusted valuation (PEG 0.43, forward P/E 19.5x).
The pullback from $460 to $384 has reset the risk/reward to a level where the asymmetry favors longs: ~24% upside to target versus ~19% to stop, with the potential for $525+ in a bull scenario. The risks are real and concentrated — a leveraged balance sheet, extreme cyclicality, and universal insider selling — but they are knowable and manageable with discipline. The next 60 days (Q3 earnings) will be the make-or-break catalyst.
For options traders, STX's high implied volatility and strong fundamentals make it a potential candidate for the wheel strategy. You can also review criteria for selecting the best stocks for the wheel strategy or consider selling cash-secured puts to build a position at a discount. For reducing cost basis on shares you already own, see how to lower your stock basis using options.
Sources: SEC Filings, Finviz, Polygon.io, Google News, Reddit, Twitter/X. Report compiled March 15, 2026.
Frequently Asked Questions
Is STX a good stock to buy right now?
Based on this analysis, STX is rated a BUY at $383.71 with a 12-month price target of $475 (+24% upside). The thesis rests on Seagate's HAMR technology moat, AI-driven storage demand, and a forward P/E of 19.5x with a PEG ratio of 0.43. The main risks are balance sheet leverage and cyclical demand reversal. Position sizing should be 3-5% of a portfolio with a hard stop at $310.
What is the STX stock price target for 2026?
The Wall Street consensus price target for STX is $485, representing roughly 26% upside from current levels. Individual analyst targets range from $380 (BNP Paribas) to $500 (TD Cowen). This analysis sets a base-case 12-month target of $475, with a bull-case target of $525 if HAMR adoption and AI storage demand exceed expectations.
Should I buy or sell STX stock?
The recommendation is to buy on the 16.6% pullback from the all-time high. Scale into a position at $375-385 with a second tranche on either a confirmed break above $400 or a pullback to $342-350. Sell signals include a break below $342 or a Q3 FY2026 earnings miss. This is not a buy-and-forget stock — it requires active management.
What is the STX stock forecast for 2026 and beyond?
In the base case, STX reaches $475 within 12 months driven by continued AI storage demand and HAMR ramp. The bull case sees $525+ if margins hold above 42% and data center buildouts accelerate. The bear case is $158 if a cyclical demand reversal hits, which would compress margins back toward the historical 28-30% range. The next major catalyst is Q3 FY2026 earnings in April/May 2026.