TMO (Thermo Fisher) Stock Analysis: Buy at $470 | $575 Target
Table of Contents
Executive Summary
This Thermo Fisher Scientific stock analysis covers TMO's fundamentals, technicals, SEC filings, market sentiment, and insider activity as of March 2026. Here is the bottom line:
- BUY on the 27% pullback from December 2025 highs. TMO's forward P/E of 17.5x is 30% below its 5-year average of ~25x and the cheapest valuation since the March 2020 COVID crash. At $470, the stock is pricing in near-zero growth for a company that generates $6–7B in free cash flow every year regardless of revenue cycles.
- Life Sciences Solutions posted its first YoY growth in 3 years (+8% in FY2025), signaling the post-COVID normalization hangover is finally ending. This segment is the single biggest revenue driver and its recovery is the key bull catalyst.
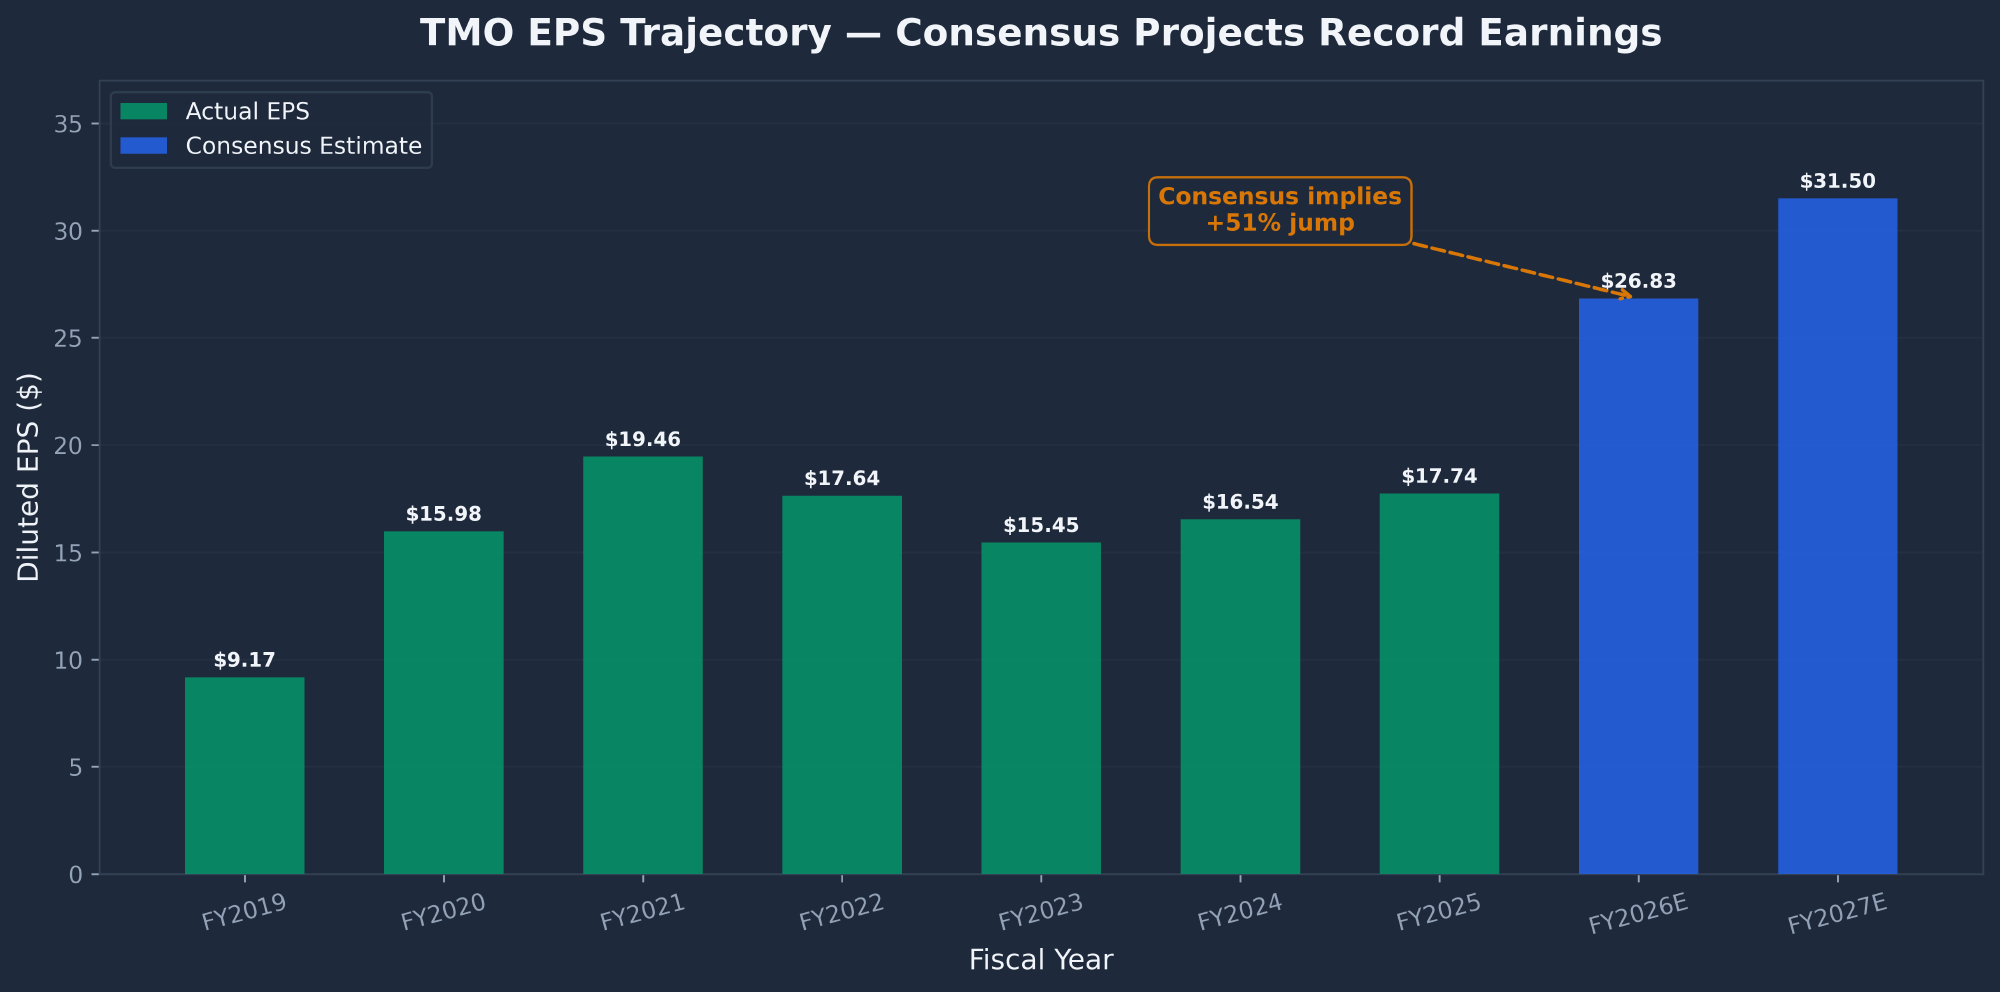
- Q4 2025 revenue grew +7% YoY and beat estimates. FY2026 guidance of $26.83 adjusted EPS would be a +51% jump — the largest non-COVID EPS increase in company history. This is the consensus number the market needs to believe.
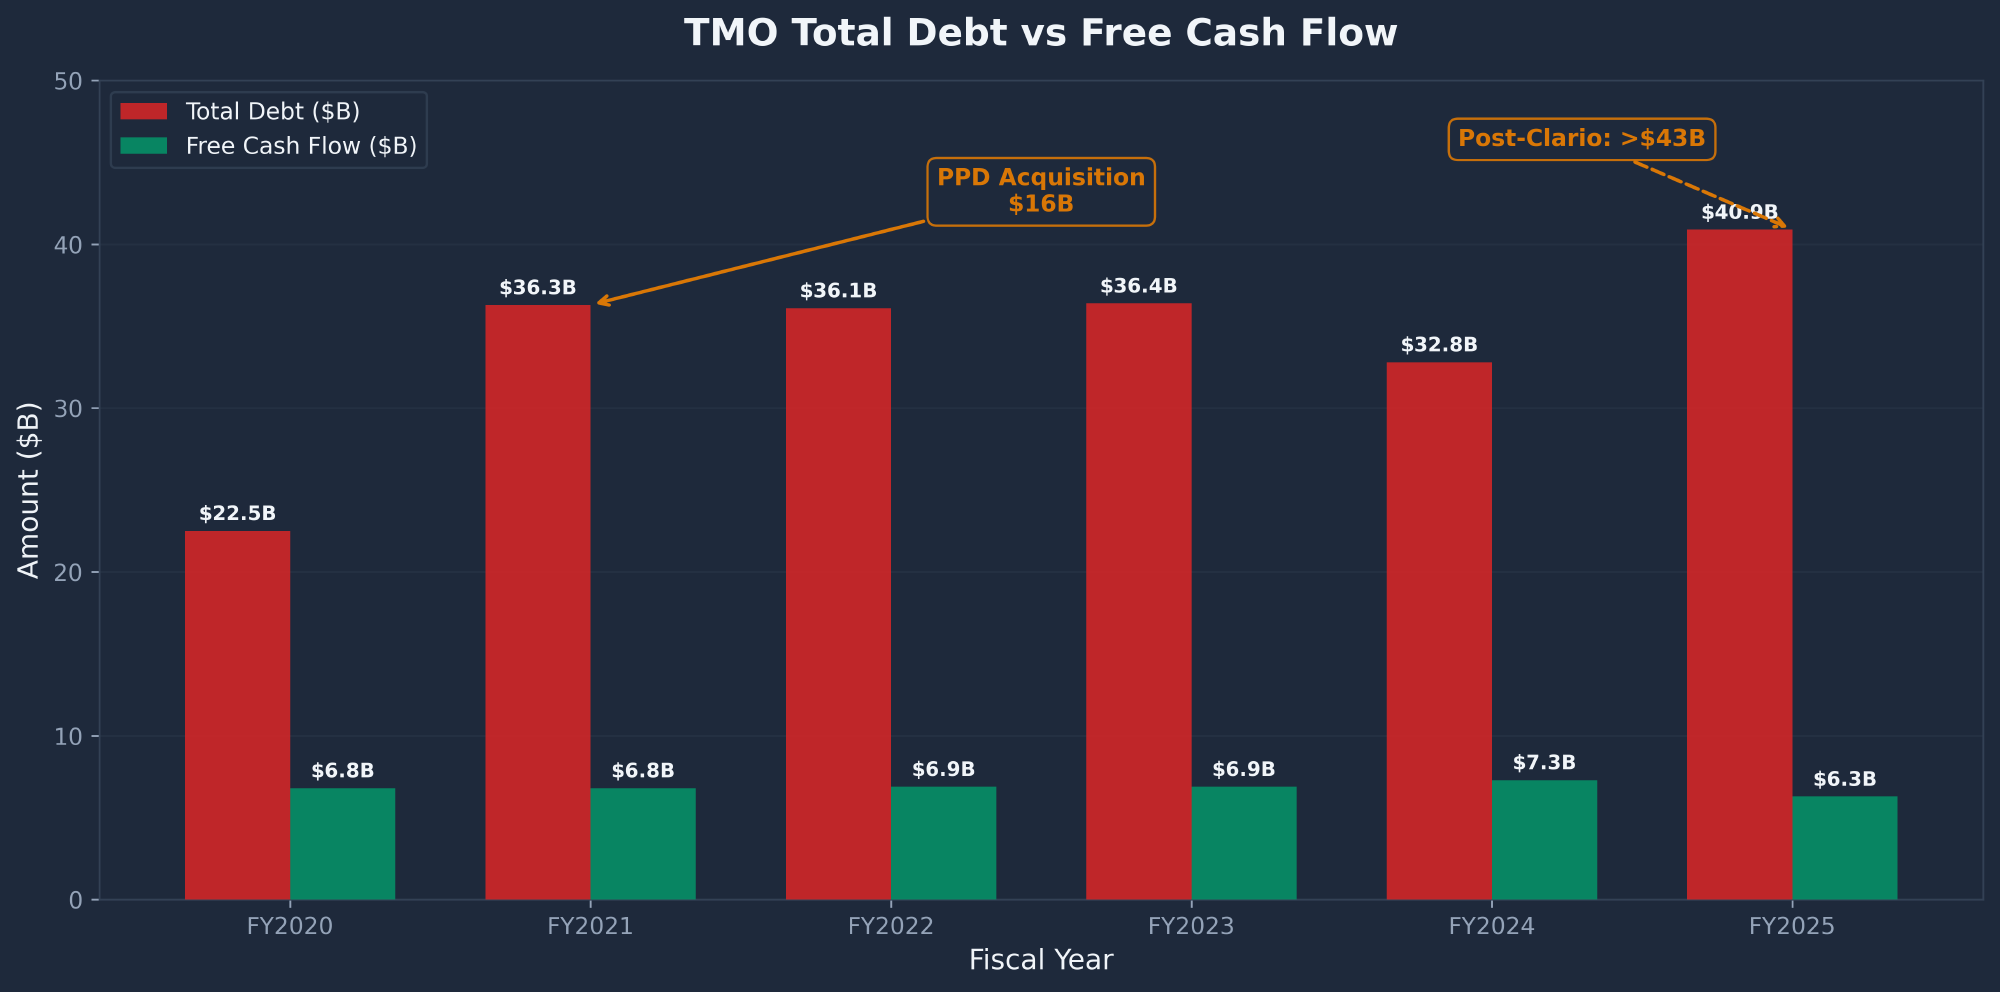
- The pending $8.875B Clario acquisition (expected mid-2026) adds ~$1.5B annualized revenue and complements the $16B PPD CRO platform. But it pushes total debt above $43B with $1.7B annual interest expense.
- Insider selling is heavy — 98 sells vs. 2 purchases over 5 years, with CEO Casper selling $392M. But this is consistent with systematic option monetization at a mega-cap, not a directional call on the business.
| Report | Signal | Key Finding |
|---|---|---|
| Fundamentals | BULLISH | $44.6B revenue, $6.3B FCF, 17.5x fwd P/E (30% below 5yr avg), Life Sci recovery |
| Technical | BEARISH | Below all MAs, RSI 28 (oversold), MACD deeply negative, death cross imminent. But RSI 28 is contrarian bullish. |
| SEC Filings | BULLISH | Management beats guidance consistently, FCF resilient, PPI system proven, disciplined SBC (<1% of rev) |
| News | BULLISH | Goldman top healthcare pick, Morningstar best value, JP Morgan top pick 2026, 10% div increase, NVIDIA AI partnership |
| Sentiment | MIXED | Value investors circling (r/ValueInvesting "dream buy"). Bears cite NIH cuts, insiders, debt. |
| Insider Trading | BEARISH | 98 sells vs 2 buys ($683M sold, $13K purchased). CEO $392M. Failed say-on-pay vote. |
| COMPOSITE | BUY | 4 bullish, 1 bearish, 1 divergent. Valuation + FCF + institutional support override technical weakness and insider selling. |
Investment Thesis
Thermo Fisher Scientific is the world's largest life sciences company by revenue, serving pharmaceutical, biotech, academic, and government customers across 70+ countries with 125,000 employees. The company has spent $35B on acquisitions over 5 years, building an unmatched platform spanning analytical instruments (Thermo Scientific), genetic analysis (Applied Biosystems), research reagents (Invitrogen), lab distribution (Fisher Scientific), CDMO services (Patheon), and clinical research (PPD).
The stock has pulled back 27% from its December 2025 peak of $644, creating the most attractive entry point since the COVID crash. At 17.5x forward earnings, TMO trades at a 37% discount to Danaher's ~28x and 30% below its own 5-year average. This discount exists because the market is pricing in three fears: (1) tariff headwinds on Analytical Instruments, (2) NIH/DOGE budget cuts affecting academic customers, and (3) $43B+ debt post-Clario. I believe these fears are overblown relative to the company's proven ability to generate $6–7B in FCF through any macro environment.
The entry strategy: scale in over 3 tranches — buy 1/3 at $470, add 1/3 if the stock tests $450, and add the final 1/3 on confirmation of Q1 2026 earnings (April/May). Hard stop at $385 (52-week low, -18% risk). Take 50% profit at $550–575, let the remainder run toward $650+ with a trailing stop.
Fundamental Analysis
Revenue & Gross Margin
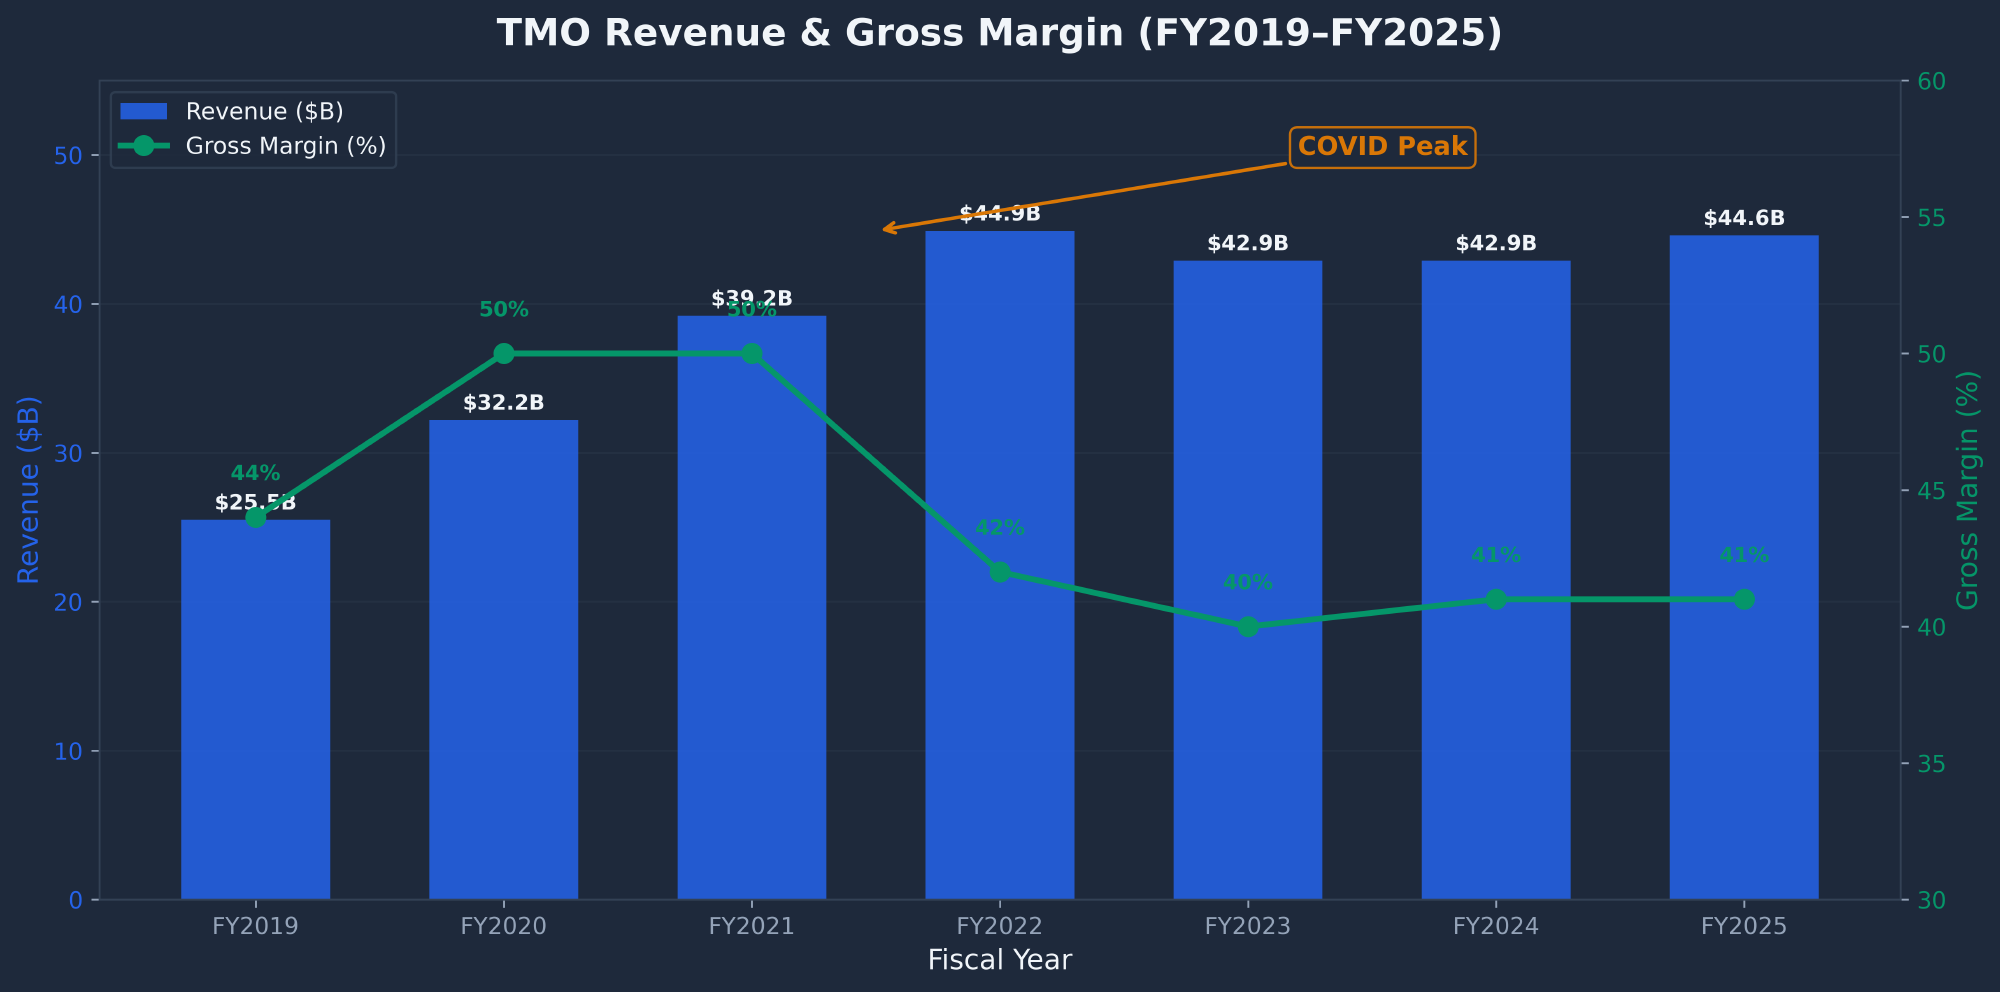
| Metric | FY2025 | FY2024 | FY2023 | FY2022 | FY2021 |
|---|---|---|---|---|---|
| Revenue ($B) | 44.6 | 42.9 | 42.9 | 44.9 | 39.2 |
| Gross Margin | 41% | 41% | 40% | 42% | 50% |
| Operating Margin | 18.8% | 17.9% | 17.4% | 19.0% | 26.3% |
| EPS (Diluted) | $17.74 | $16.54 | $15.45 | $17.64 | $19.46 |
| Free Cash Flow ($B) | 6.3 | 7.3 | 6.9 | 6.9 | 6.8 |
| Interest Expense ($B) | 1.7 | 1.65 | 1.49 | 0.73 | 0.54 |
EPS Trajectory
Debt vs Free Cash Flow
Peer Comparison
| Metric | TMO ($470) | DHR (~28x) | A (~25x) | IQV (~18x) |
|---|---|---|---|---|
| Forward P/E | 17.5x | ~28x | ~25x | ~18x |
| EV/EBITDA | 18.4x | ~22x | ~20x | ~15x |
| Operating Margin | 18.8% | ~25% | ~22% | ~18% |
| Revenue Growth | +3.9% | ~5% | ~4% | ~5% |
TMO trades at a 37% discount to Danaher. Even partial closing of this valuation gap would drive TMO toward $550+.
Technical Analysis
TMO is deeply oversold with an RSI of 28 — the lowest reading since March 2020. The stock sits on the 23.6% Fibonacci retracement ($469.50) of the entire Oct 2023–Dec 2025 rally. A completed head-and-shoulders pattern targets $415. But historically, sub-25 RSI readings at TMO have preceded 5–10% relief rallies within 1–2 weeks.
| Indicator | Value | Signal |
|---|---|---|
| SMA 50 | $556.59 | BEARISH (-15.6%) |
| SMA 200 | $513.51 | BEARISH (-8.5%) |
| RSI (14) | 28.14 | OVERSOLD (Contrarian Bullish) |
| MACD | -20.14 / Signal: -18.11 | BEARISH (most extreme reading) |
| Beta | 1.00 | MARKET-WEIGHT |
| ATR (14) | $14.77 (3.1%) | ELEVATED |
Key levels: Support at $463 (recent low), $415–420 (Oct 2023 capitulation), $385 (52-week low). Resistance at $496 (SMA 10), $513 (SMA 200), $557 (SMA 50).
SEC Filings Deep Dive
TMO's filings reveal a company with remarkably consistent execution across revenue cycles. The PPI Business System (Practical Process Improvement) — a proprietary operating model refined over 20 years — drives acquisition integration and margin expansion. SBC runs at <1% of revenue, far below tech-sector norms.
The FY2025 10-K introduced two new risk factors: China local supplier mandates (threatening the 18% Asia-Pacific revenue base) and tariff exposure on Analytical Instruments. These are real headwinds but manageable for a company with operations in 70+ countries and demonstrated pricing power.
$49.4B in goodwill (45% of total assets) from the acquisition spree is the balance sheet's Achilles heel. The Solventum filtration business ($2.1B goodwill) carries an explicit impairment warning in the 10-K. A large write-down would not affect cash flow but could trigger headline-driven selling and rating agency scrutiny.
News & Catalysts
Analyst Ratings
Consensus target: $666 (+42% upside). Rating: 1.41 (Strong Buy). 9 of 11 recent ratings are bullish. Goldman Sachs named TMO a top healthcare pick (Mar 15). JP Morgan named TMO a top stock pick for 2026. Morningstar selected TMO as best healthcare value stock. KeyBanc has the highest target at $750 (+60%).
Catalysts Calendar
| Timing | Event | Expected Impact |
|---|---|---|
| Apr/May 2026 | Q1 2026 Earnings + FY2026 Guidance | THE EVENT. Will confirm or refute $26.83 consensus. Beat = strong rally. |
| Mid-2026 | Clario acquisition closes ($8.875B) | Adds ~$1.5B annualized revenue. Smooth close = bullish. |
| Mar 31, 2026 | CFO transition (Meyer replaces Williamson) | Low impact. Planned succession. |
| Ongoing | NIH/DOGE budget resolution | Resolution removes major overhang on academic customer spending. |
| Ongoing | NVIDIA/TetraScience AI partnership progress | Positions TMO at AI + lab automation intersection. Early stage but high narrative value. |
Market Sentiment
Sentiment is mixed but constructive among value investors. TMO appeared in multiple r/ValueInvesting "dream buy" and "great companies in bad moments" threads. JP Morgan's "Top Stock Picks for 2026" post on r/stocks received 350 upvotes and highlighted TMO. The bear arguments (NIH cuts, insiders selling, flat growth) are well-known and likely priced in at 17.5x forward.
Insider & Institutional Activity
The insider selling looks alarming on the surface ($683M sold vs $13K purchased), but context matters. At a $175B mega-cap with 0.17% insider ownership, these are systematic option exercises via 10b5-1 plans — not panic selling. CEO Casper has been at the helm since 2009 with 800% total shareholder return. The failed say-on-pay vote over a $60M retention grant is a governance blemish but not thesis-breaking.
More importantly: institutions own 94.5% and are net buyers (+1.46%). Short interest is a negligible 0.96%. EdgePoint recently boosted its stake 5.0% to a $673M position. This is institutional-quality money flowing in as insiders exercise options.
Risk Factors
| Risk | Probability | Impact |
|---|---|---|
| FY2026 EPS estimates get slashed. Consensus $26.83 implies +51% jump. If cut 15–20%, stock goes to $374. | 25% | -20 to -25% |
| China local supplier mandates accelerate. 18% Asia-Pacific revenue at structural risk. | 30% | -10 to -15% |
| Goodwill impairment. $49.4B goodwill, Solventum carries explicit warning. Large writedown triggers selling. | 20% | -10 to -15% |
| NIH/DOGE budget cuts reduce academic spending. Could create 2–3 year headwind. | 40% | -5 to -10% |
| Credit downgrade. $43B+ debt post-Clario could pressure investment-grade rating. | 10% | -15 to -20% |
| Clario deal collapses or is delayed. Regulatory or integration concerns. | 10% | -10 to -15% |
Conclusion & Price Targets
| Scenario | FY27E EPS | Target P/E | 12-Mo Target | Return |
|---|---|---|---|---|
| Bear (30%) | $23.50 | 15x | $353 | -24.9% |
| Base (45%) | $28.75 | 20x | $575 | +22.3% |
| Bull (25%) | $31.50 | 23x | $725 | +54.3% |
Bull Case ($725)
- Life Sciences recovery sustains mid-single-digit growth
- Clario closes smoothly, adds $1.5B revenue
- Multiple re-rates from 17.5x toward historical 23x
- NVIDIA AI partnership drives lab automation narrative
- FCF grows to $8.8B by FY2028
Bear Case ($353)
- FY2026 EPS guidance comes in below $25
- China mandates erode 18% Asia-Pacific revenue
- Goodwill impairment triggers institutional selling
- NIH/DOGE cuts create 2–3 year headwind
- $43B debt burden leads to credit downgrade
Action Plan
| If You... | Action |
|---|---|
| Have no position | Buy 1/3 at $470. Add 1/3 at $450 support. Add final 1/3 on Q1 earnings confirmation. Hard stop $385. |
| Already own shares | Hold. Consider adding on any dip below $450. Raise stop to breakeven if stock reaches $550+. |
| Want to speculate | Sell cash-secured puts at the $420 or $400 strike. Collect premium while getting a below-market entry if assigned. |
TMO is an excellent candidate for the wheel strategy at current levels — a high-quality, blue-chip name trading at a historically cheap valuation with deep institutional ownership. For more on using options to lower your cost basis, see the guide.
Frequently Asked Questions
Is TMO a good stock to buy?
Yes — TMO is a Buy at $470 with a $575 price target (+22%). The forward P/E of 17.5x is the cheapest valuation since March 2020 and 30% below the 5-year average. Thermo Fisher generates $6–7B in free cash flow annually regardless of revenue cycles, just raised its dividend 10%, and has a 94.5% institutional ownership base that is actively adding positions. The pullback is driven by tariff fears, NIH budget uncertainty, and debt concerns — real but manageable risks for a company with TMO's scale and cash flow generation.
What is the TMO price target for 2026?
The analyst consensus TMO price target is $666 (+42% upside), with a range from UBS at $460 to KeyBanc at $750. My base case target is $575 based on $28.75 adjusted FY2027 EPS at 20x P/E (conservative versus the historical 25x average). The bull case targets $725 if Clario integrates smoothly and margins expand. The bear case is $353 if EPS estimates get cut and the multiple contracts to 15x on debt concerns.
Should I buy or sell TMO?
Buy, but scale in rather than going all-in. The RSI of 28 signals the stock is deeply oversold, and historical sub-25 readings have preceded 5–10% relief rallies. However, the MACD is at its most negative reading and a death cross is imminent, so further downside to $415–450 is possible before the bottom forms. A 3-tranche entry ($470, $450, post-Q1 earnings) with a hard stop at $385 balances the opportunity with the risk.
TMO stock forecast for 2026 and beyond?
TMO's near-term trajectory depends on Q1 2026 earnings (April/May) and the Clario acquisition close (mid-2026). If both go well, the stock should re-rate toward $550–575 as the forward P/E mean-reverts from 17.5x toward 20x. Longer-term, consensus projects $48B revenue by FY2027 and $54B by FY2028, with EPS reaching $31–34. The 20-year track record of acquiring, integrating, and optimizing businesses via the PPI system gives confidence in execution. TMO has compounded at 800% total shareholder return under CEO Casper since 2009.
Sources: SEC Filings (10-K, 10-Q, 8-K, DEF 14A), Finviz, Polygon.io, Google News, Reddit, Twitter/X. Report compiled March 16, 2026.